Translate this page into:
Impact of long-term deep freeze storage on human leukocytes viability & DNA extraction: Insights from a resource-limited biorepository

* Corresponding author: Dr. Prachi Kukshal, Department of Genomics Research, Sri Sathya Sai Sanjeevani Research Foundation, Palwal, Haryana, India. drprachi.kukshal@gmail.com
-
Received: ,
Accepted: ,
How to cite this article: Ahamad S, Kumar A, Guhathakurta S, Kukshal P. Impact of long-term deep freeze storage on human leukocytes viability & DNA extraction: Insights from a resource-limited biorepository. Ann Natl Acad Med Sci (India). doi: 10.25259/ANAMS_210_2024
Abstract
This study examined the effects of cryopreservation at -80°C, without cryoprotectants, on leukocyte viability in blood samples over different time intervals. Leukocytes have a lifespan of approximately 20 days at 4°C. They constitute about 1% of blood, and their integrity is vital for DNA and RNA extraction in biobanking. Our findings demonstrate that leukocytes remain viable for up to one year at -80°C, making them suitable for molecular biology studies. This research supports the long-term storage of blood samples for future biomedical research.
Keywords
DNA
Biobank
Human leukocytes

INTRODUCTION
The term ‘biobank’ introduced in 1996, refers to a specialized repository that systematically collects, processes, preserves, and distributes a variety of biospecimens under controlled conditions (e.g. Deoxyribonucleic acid [DNA], ribonucleic acid [RNA], body fluids, cells, tissues, etc.) with detailed clinical and demographic information, primarily for biomedical research.1 Biobanks can be categorized as population-based or disease-oriented biobanks and may focus on specific biospecimens. There is a variety of biobanks, such as tissues, cells, organoids, liquids, imaging, or digital biobanks. To maintain sample integrity, specimens are often stored at extremely low temperatures, ranging from -20°C to -80°C, or cryopreserved in liquid nitrogen at -196°C.2
Blood is the most preferred biospecimen due to its ease of processing, wide availability, and extensive applications. Laboratory assessments of circulatory blood cell size and quantity are typically conducted via complete blood count (CBC) tests, which evaluate various parameters, including red blood cells (RBC), mean corpuscular volume (MCV), red cell distribution width (RDW), hematocrit, platelets, mean platelet volume (MPV), platelet distribution width (PDW), platelet crit, large-platelet cell ratio (LPCR), white blood cells (WBC), hemoglobin, mean corpuscular hemoglobin (MCH), mean corpuscular hemoglobin concentration (MCHC), lymphocytes, granulocytes, and mid-sized white blood cells (MID).3
A recent study found that at 4°C, hematological indices remain stable for up to eight days.4
WBCs or leukocytes, including basophils, eosinophils, lymphocytes, monocytes, and neutrophils, play a crucial role in the immune system. Their nuclei contain genetic material, making their viability essential during long-term storage. However, cryopreservation can reduce viability and functional integrity and trigger senescence over time.5 While numerous studies have evaluated the effects of low temperatures and long-term storage – with or without cryoprotectants - limited research exists on incubations exceeding one year, particularly in resource-limited settings like India.6-9
MATERIAL AND METHODS
Study samples
The study involved five healthy Indian adults who provided written informed consent, following approval from the Institutional Ethics Committee at Sri Sathya Sai Sanjeevani Research Centre, Palwal (India), a Department of Scientific and Industrial Research - Scientific and Industrial Research Organizations certified non-governmental organization. All participants had no recent blood transfusions, infections, fever, iron supplementation, or chronic/hematological disorders based on clinical history.
Storage conditions and hematological profiling
Whole blood was collected in sodium ethylenediaminetetraacetic acid vials and stored at -80°C in a CryoCube Freezer (Eppendorf, Germany) for various time intervals (0, 1, 2, 4, and 18 months). The CBC analysis was performed using a Swelab Alfa Hematology Analyzer (Boule, Sweden).
DNA extraction, quality, and quantity estimation
Genomic DNA was manually isolated from ∼2 ml blood at each time interval using a non-enzymatic salting out method.10 The isolated DNA was visualized on 1% agarose gel stained with ethidium bromide dye and imaged with the ChemiDoc XRS Gel Imaging System (Bio-Rad, United States). Quantity and quality were assessed with NanoDropTM UV Visible Spectrophotometer (Thermo Fisher Scientific, United States).
Statistical analysis
Data were analyzed using IBM SPSS 21.0 and MS Excel, with readings presented as mean ± SD for normally distributed continuous data. The analysis of variance test and univariate logistic regression were used to compare CBC indices across periods, with a significance threshold set at p ≤ 0.05. Correlation strength was determined by Chan.11
RESULTS
Characteristics of the participants
A total of 10 mL of whole blood was collected from 2 males and 3 females, with a median age of 40 years (range: 30-65). All participants had normal blood pressure (120/80 mmHg), SpO2 levels (∼99%), and body mass index of 22.5 ± 1.3.
Comparison of CBC indices of blood stored at -80°C for different intervals
Blood samples stored for various durations (0, 1, 2, 4, and 18 months) underwent a CBC test to assess cell viability [Table 1]. After a year, RBC counts significantly dropped (p = 0.029) while RDW, MCV, MCH, and MCHC increased (p < 0.05). WBC counts decreased by 54.6% over time, while lymphocytes increased initially but remained stable thereafter (p = 0.296). PDW was also increased over time (p < 0.05).
| Variables | Normal ranges | Time intervals (Mean ± SD) | pvalues | Overall trend (%) | ||||||||
|---|---|---|---|---|---|---|---|---|---|---|---|---|
| 0 month (baseline) | 1 month | 2 month | 4 month | 18 month | 1 M | 2 M | 4 M | 18 M |
Short term (0→4 M) |
Long term (0→18 M) |
||
| Red cell- related parameters | ||||||||||||
| RBC (x 1012/L) | 3.5-5.5 | 4.78 ± 0.59 | 4.38 ± 0.79 | 4.36 ± 0.73 | 3.94 ± 0.84 | 3.72 ± 0.67 | 0.384 | 0.344 | 0.103 | 0.029 | ↓ 17.6% | ↓ 22.2% |
| Haemoglobin (g/dL) | 11.5-16.5 | 12.52 ± 1.56 | 12.26 ± 1.95 | 12.56 ± 1.97 | 11.84 ± 2.20 | 12.14 ± 1.47 | 0.822 | 0.973 | 0.588 | 0.702 | ↓ 5.4% | ↓ 3.0% |
| Haematocrit (%) | 35.0-55.0 | 39.20 ± 4.01 | 44.68 ± 6.55 | 44.78 ± 6.59 | 41.16 ± 7.98 | 35.94 ± 4.95 | 0.149 | 0.144 | 0.241 | 0.285 | ↑5.0% | ↓ 8.3% |
| RDW (%) | 11.0-16.0 | 12.98 ± 1.27 | 18.30 ± 1.47 | 18.52 ± 1.62 | 18.62 ± 1.41 | 23.00 ± 1.13 | 0.0003 | 0.0003 | 0.0002 | 0.0001 | ↑ 43.5% | ↑ 77.2% |
| RDWa (fl) | 30.0-150.0 | 57.26 ± 3.94 | 86.00 ± 18.95 | 90.76 ± 12.13 | 94.1 ± 11.50 | 100.42 ± 12.02 | 0.011 | 0.0004 | 0.0001 | 0.0001 | ↑ 64.3% | ↑ 75.4% |
| MCV (fl) | 75.0-100.0 | 82.1 ± 2.26 | 103.1 ± 7.66 | 102.7 ± 7.88 | 105.1 ± 6.16 | 97.3 ± 7.19 | 0.0004 | 0.0005 | 0.0001 | 0.002 | ↑ 28.1% | ↑ 18.5% |
| MCH (pg) | 25.0-35.0 | 26.26 ± 1.14 | 28.18 ± 1.84 | 28.76 ± 2.18 | 30.24 ± 1.69 | 32.98 ± 2.20 | 0.083 | 0.053 | 0.002 | 0.0003 | ↑ 15.2% | ↑ 25.6% |
| MCHC (g/dL) | 31.0-38.0 | 32.00 ±1.29 | 27.50 ± 3.38 | 28.18 ± 3.49 | 28.86 ± 2.75 | 33.94 ± 2.40 | 0.024 | 0.049 | 0.051 | 0.150 | ↓ 9.8% | ↑ 6.1% |
| White cell related parameters | ||||||||||||
| WBC (x 109/L) | 3.5-10.0 | 6.26 ± 0.79 | 5.14 ± 0.84 | 4.94 ± 0.78 | 4.72 ± 0.65 | 2.84 ± 0.93 | 0.063 | 0.029 | 0.010 | 0.0001 | ↓ 24.6% | ↓ 54.6% |
| Lymphocytes (x 109/L) | 0.5-5.0 | 1.82 ± 0.23 | 3.46 ± 0.46 | 3.68 ± 0.31 | 3.54 ± 0.39 | 2.22 ± 0.77 | 0.0001 | 0.0001 | 0.0001 | 0.296 | ↑ 94.5% | ↑ 22.0% |
| Granulocytes (x 109/L) | 1.2-8.0 | 4.04 ± 0.85 | 0.48 ± 0.43 | 0.44 ± 0.25 | 0.36 ± 0.11 | 0.34 ± 0.15 | 0.0001 | 0.0001 | 0.0001 | 0.0001 | ↓ 91.1% | ↓ 91.6% |
| MID (x 109/L) | 0.1-1.5 | 0.40 ± 0.17 | 1.00 ± 0.32 | 1.02 ± 0.33 | 0.82 ± 0.18 | 0.28 ± 0.05 | 0.006 | 0.006 | 0.005 | 0.172 | ↑ 105.0% | ↓ 30.0% |
| Platelet related parameters | ||||||||||||
| Platelet counts (x 109/L) | 100.0-400.0 | 256.4 ± 46.72 | 254.8 ± 59.24 | 254.2 ± 64.01 | 248.6 ± 60.36 | 247.4 ± 70.16 | 0.963 | 0.952 | 0.825 | 0.817 | ↓ 3.0% | ↓ 3.5% |
| MPV (fl) | 8.0-11.0 | 8.90 ± 0.85 | 9.80 ± 0.75 | 10.00 ± 0.82 | 9.56 ± 0.56 | 9.52 ± 0.60 | 0.113 | 0.070 | 0.185 | 0.218 | ↑ 7.4% | ↑ 6.9% |
| PDW (fl) | 0.1-99.9 | 12.20 ± 1.13 | 13.98 ± 1.25 | 14.66 ± 1.43 | 14.23 ± 1.08 | 14.20 ± 0.93 | 0.045 | 0.017 | 0.016 | 0.021 | ↑ 16.6% | ↑ 16.4% |
| Plateletcrit (%) | 0.01-9.99 | 0.22 ± 0.03 | 0.24 ± 0.05 | 0.25 ± 0.07 | 0.24 ± 0.05 | 0.23 ± 0.07 | 0.618 | 0.486 | 0.611 | 0.787 | ↑ 9.1% | ↑ 4.5% |
| LPCR (%) | 0.1-99.9 | 20.74 ±6.12 | 28.50 ± 5.96 | 31.28 ± 6.41 | 28.82 ± 4.02 | 27.72 ± 4.94 | 0.077 | 0.029 | 0.039 | 0.083 | ↑ 33.7% | ↑ 38.9% |
LPCR: Large-platelet cell ratio, MCH: Mean corpuscular hemoglobin, MCHC: Mean corpuscular hemoglobin concentration, MCV: Mean corpuscular volume, MPV: Mean platelet volume, PDW: Platelet distribution width, RBC: Red blood cells, RDW: Red cell distribution width, WBC: White blood cells, MID: Mid-sized white blood cells.
Significant p values (p < 0.05) are in bold font.
Univariate logistic regression of leukocyte counts with Other CBC indices
The univariate logistic regression revealed a strong positive correlation for granulocytes with r values of 0.99, 0.92, 0.85, and 0.91 at 0, 2, 4, and 18 months, respectively; lymphocytes with r values of 0.93, 0.98, and 0.99 at 2, 4, and 18 months, respectively; and MID cells with r values of 0.93, 0.97 and 0.96 at 1, 2 and 4 months, respectively. MPV was negatively associated with leukocyte counts at 0 months (r = -0.89) [Figure 1].
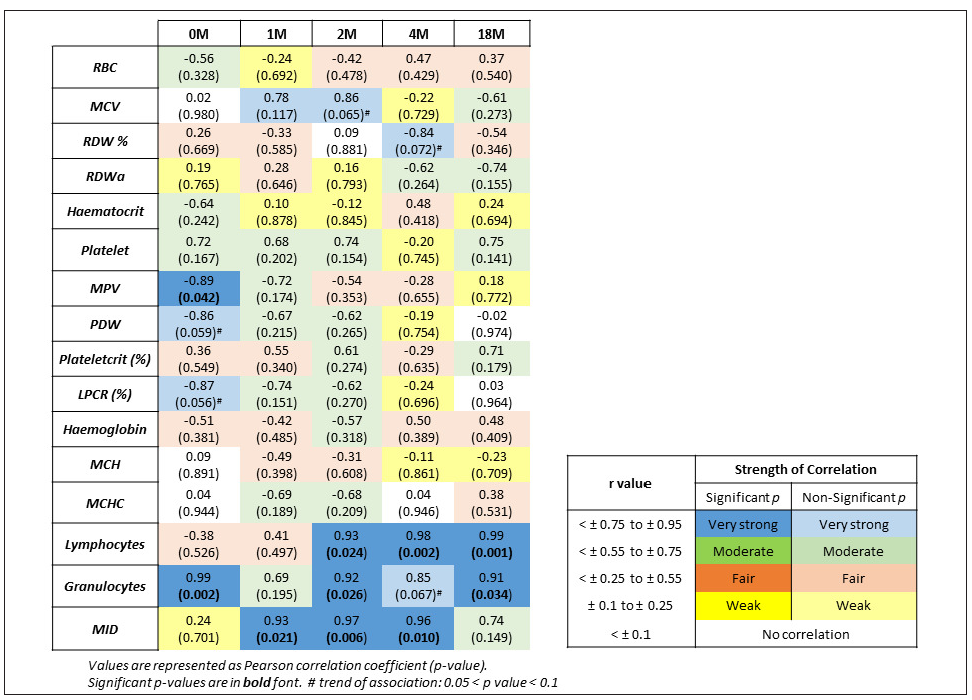
- Correlation of leukocytes with other hematological parameters at different intervals. MCH: Mean corpuscular hemoglobin, MCHC: Mean corpuscular hemoglobin concentration, MCV: Mean corpuscular volume, MPV: Mean platelet volume, PDW: Platelet distribution width, RBC: Red blood cells, RDW: Red cell distribution width, MID: Mid-sized white blood cells, LPCR: Large-platelet cell ratio.
Analysis of extracted DNA from stored blood
The isolated DNA exhibited good quality (O.D. 260/280 = 1.83 ± 0.02) across all periods (p = 0.07) [Figure 2]. Although the quantity of DNA was satisfactory (202.82 ± 51.11 ng/μL), it significantly decreased with longer storage (p = 0.005). The variability in DNA quality across different time-periods can likely be attributed to the manual method of isolation, even though the same reagents were used in each set.
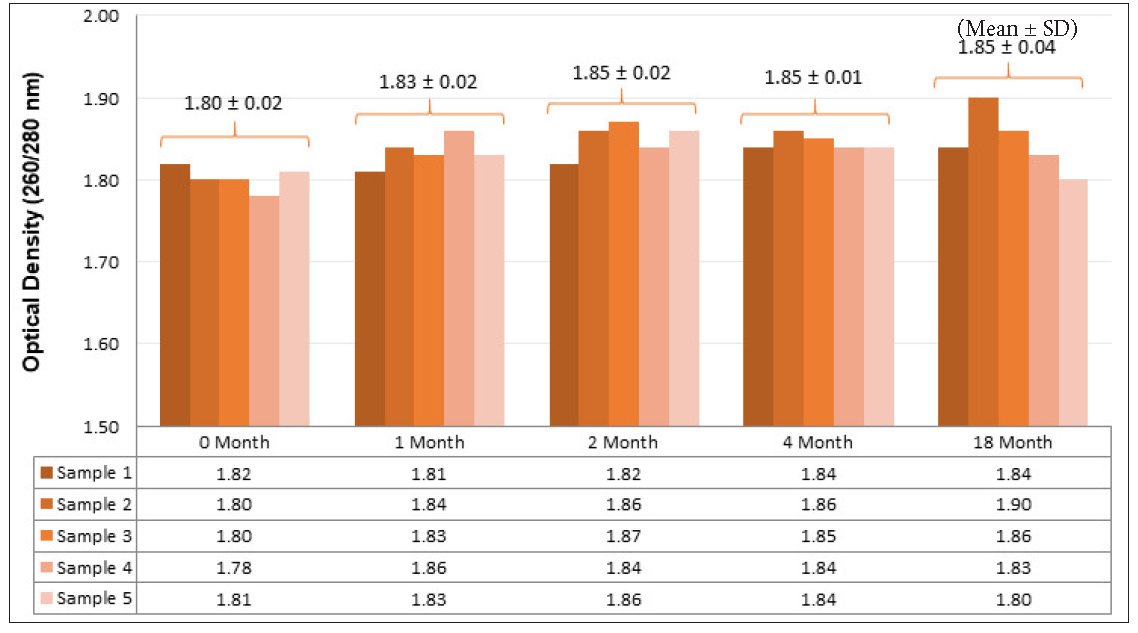
- Quality estimation of isolated DNA at different intervals. DNA: Deoxyribonucleic acid.
DISCUSSION
A meta-analysis indicated that blood samples can be reliably incubated at 4°C for metabolomics study.6 However, the viability of RBCs and their associated parameters – hemoglobin, hematocrit, RDW, MCV, MCH, and MCHC diminish due to altered RBC metabolism, increased oxidative stress, and membrane damage and has a shelf life of up to 42 days at 4°C.12 In our study, RBC remained stable for 4 months and significantly decreased over time (17.6% vs 22.2%), while hemoglobin & hematocrit showed no change.
Platelets stored in 6% dimethyl sulfoxide can last 3 years at -80°C but in our research, platelet-related parameters such as platelet counts, MPV, and plateletcrit didn’t significantly change over time, although PDW increased by ∼16.6% without the cryoprotectant.9 LPCR remained stable for one month but showed a non-significant increase in long-term storage (p = 0.083) [Table 1].
A recent study from low-resource settings in Sri Lanka and Turkey found that most CBC parameters remained stable at 4°C, 25°C, and 33°C over 6, 24, and 48 hours, with platelets remaining unaffected for up to 4 days at 4°C.7,8 However, WBC counts, including granulocytes, decreased drastically (54.6% and 91.6%, respectively), while lymphocytes increased by 22% non-significantly. This leukopenia and lymphocytosis may explain the lower DNA yield from long-term stored blood compared to fresh samples (p = 0.005). Lymphocytes, granulocytes, and MID cells significantly dropped, with a decrease in leukocyte counts after 2 months of storage (r > 0.9; p < 0.05) [Figure 1].
Factors such as slow freeze-thaw cycles, decreased phagocytic activity, reduced cytokine production, and the choice of cryoprotectants may lead to cell senescence and functional loss during prolonged storage of leukocytes.13
CONCLUSION
We conclude that for molecular biology research, blood samples can be stored for up to one year at -80°C without compromising the quantity of nucleic acid. Utilizing appropriate cryoprotectants at optimal concentrations could further enhance viability. Future studies involving larger cohorts, varying incubation temperatures, and extended storage durations will provide deeper insights and validate these findings.
Acknowledgements
The authors acknowledge Mr. Chanderhash, Mr. Shyamsunder and Dr. Radha Joshi for experimental assistance. The authors also acknowledge lab technicians Mr. Prem and Mr. Deepak for performing CBC tests.
Authors’ contributions
SA: Design, literature search, data acquisition, data analysis, manuscript writing; AK: Experimental study, data acquisition; SG: Conceptualization; PK: Design, manuscript review, and editing. All authors have read and approved the final version of the manuscript.
Ethical approval
The research/study approved by the Institutional Review Board at Sri Sathya Sai Sanjeevani Research Foundation, Palwal (India), number PS00003/IEC/1/2019, dated 15th November 2019.
Declaration of patient consent
The authors certify that they have obtained all appropriate patient consent.
Financial support and sponsorship
Nil.
Conflicts of interest
There are no conflicts of interest.
Use of artificial intelligence (AI)-assisted technology for manuscript preparation
The authors confirm that there was no use of artificial intelligence (AI)-assisted technology for assisting in the writing or editing of the manuscript and no images were manipulated using AI.
REFERENCES
- Cancer risk and oxidative DNA damage in man. J Mol Med (Berl). 1996;74:297-312.
- [CrossRef] [PubMed] [Google Scholar]
- Biobanks as an indispensable tool in the “Era” of precision medicine: Key role in the management of complex diseases, such as melanoma. J Pers Med. 2024;14:731.
- [CrossRef] [PubMed] [PubMed Central] [Google Scholar]
- Normal and Abnormal Complete Blood Count With Differential. In: StatPearls. Treasure Island (FL): StatPearls Publishing; June 8, 2024. https://www.ncbi.nlm.nih.gov/books/NBK604207/ [Last accessed 2024 August 10]
- [Google Scholar]
- Stability and comparison of complete blood count parameters between capillary and venous blood samples. Int J Lab Hematol. 2023;45:659-67.
- [CrossRef] [PubMed] [Google Scholar]
- A comprehensive analysis of the stability of blood eosinophil levels. Ann Am Thorac Soc. 2021;18:1978-87.
- [CrossRef] [PubMed] [PubMed Central] [Google Scholar]
- How long can we store blood samples: A systematic review and meta-analysis. EBioMedicine. 2017;24:277-85.
- [CrossRef] [PubMed] [PubMed Central] [Google Scholar]
- Reliability of parameters of complete blood count with different storage conditions. J Clin Lab Anal. 2017;31:e22042.
- [CrossRef] [PubMed] [Google Scholar]
- Stability of complete blood count parameters depends on the storage temperature, storage time, transport position and selected stability criterion. Scand J Clin Lab Invest. 2020;80:470-8.
- [CrossRef] [PubMed] [Google Scholar]
- Effect of WBC reduction and storage temperature on PLTs frozen with 6 percent DMSO for as long as 3 years. Transfusion. 2003;43:1162-7.
- [CrossRef] [PubMed] [Google Scholar]
- Genomic DNA isolation from human whole blood samples by non enzymatic salting out method. Int J Pharm Sci. 2014;6:198-9.
- [Google Scholar]
- Biostatistics 104: Correlational analysis. Singapore Med J. 2003;44:614-9.
- [PubMed] [Google Scholar]
- The pathophysiology and consequences of red blood cell storage. Anaesthesia. 2015;70 Suppl 1:29-37, e9-12.
- [CrossRef] [PubMed] [Google Scholar]
- Effects of storage conditions of human whole blood on the viability of lymphocytes. Int J Radiat Biol. 2008;84:613-9.
- [CrossRef] [PubMed] [Google Scholar]