Translate this page into:
Sample Size Calculation in Medical Research: A Primer
Address for correspondence Rimplejeet Kaur, PhD, Department of Pharmacology, All India Institute of Medical Sciences, Jodhpur 342005, Rajasthan, India (e-mail: sidhurimple@yahoo.com).
This article was originally published by Thieme Medical and Scientific Publishers Pvt. Ltd. and was migrated to Scientific Scholar after the change of Publisher.
Abstract
Quality of research is determined by many factors and one such climacteric factor is sample size. Inability to use correct sample size in study might lead to fallacious results in the form of rejection of true findings or approval of false results. Too large sample size is wastage of resources and use of too small sample size might fail to answer the research question or provide imprecise results and may question the validity of study. Despite being such a paramount aspect of research, the knowledge about sample size calculation is sparse among researchers. Why is it important to calculate sample size; when to calculate it; how to calculate it and what details about sample size calculation should be reported in research protocols or articles; are the lesser known basics to majority of researchers. The present review is directed to address these aforementioned fundamentals about sample size. Sample size should be calculated during the initial phase of planning of study. Several components are required for sample size calculation such as effect size, type-1 error, type-2 error, and variance. Researchers must be aware that there are different formulas for calculating sample size for different types of study designs. The researcher must include details about sample size calculation in the methodology section, so that it can be justified and it also adds to the transparency of the study. The literature about calculation of sample size for different study designs is scattered over many textbooks and journals. Scrupulous literature search was conducted to find the passable information for this review. This paper presents the sample size calculation formulas in a single review in a simplified manner with relevant examples, so that researchers may adequately use them in their research.
Keywords
sample size
medical research
clinical trials
case control study
cohort study
cross-sectional study

Introduction
Sample size is one of the key aspects of any research study. It is also one of the most overlooked part of clinical research. There are basically three reasons for it: (1) most of the researchers are not aware of importance of sample size; (2) the lack of knowledge about how to calculate sample size; and (3) due to the complex appearance of the mathematical formulas for sample size calculation, they are difficult to handle without proper training or knowledge.
Several studies have done analysis of various research articles and found several errors related to sample size such as inadequate sample to answer research question and inappropriate formula used.1,2
Through this paper, we are trying to simplify the concepts of sample size calculation, so that the researchers are able to compute them in right manner in their research projects. Explicit literature search along with the experience of the authors was used in making this review veritable and interesting.
What Is Sample Size?
It is not practical, as well as feasible, to conduct a study on the whole population related to the study. Thus, the sample of population is used which adequately represent the population from which these samples are chosen. The results obtained from experimentation on these samples are considered as true inferences about the whole population.
Sample size is defined as the number of experimental or observational units required for any research. This experimental or observational unit could be in the form of study subjects/patients, blood or visceral fluids or tissue, or a geographical area, like city, state, region, and country.
Why It Is Important to Have Adequate Sample Size?
The calculation of sample size is one of the crucial steps in planning any research. Failure in calculation of appropriate sample size may lead to false results or rejection of true finding. The term “appropriate sample size” means that the sample size should be neither more or less than actually required to answer the research question. Both the cases of more or less than needed sample size are of ethical concern. If the sample size is small in a study, it might not be able to find the precise difference between the study groups and results of such study cannot be generalized to the population, since the sample is inadequate to represent the target population. In cases where the sample size is taken larger than required, more population is exposed to risk of intervention unnecessarily, and it also results in wastage of resources and time.
As mentioned earlier, inadequate sample size may give false results, for example, if one wants to evaluate the effect of drug A on fasting blood sugar (FBS), the patients will be divided into two groups, one receiving the drug A and another group receiving the standard drug or placebo. If we make two assumptions, in one scenario the drug A decreases the FBS by 5 mg/dL in comparison to standard drug and in another scenario the drug A decreases the FBS by 10 mg/dL in comparison to standard drug. One important criterion that will play crucial role here in the sample size calculation is the “effect size.” It is defined as the minimum difference that the investigator wants to detect between study groups. It is also known as minimal clinical relevant difference. If effect size is high, less sample size will be required to prove the effect and if effect size is low, larger sample size will be needed. In this particular example, in one scenario, the effect size is 5 mg/dL, thus more patients in both groups will give statistically significant result. In the second scenario, effect size is larger, that is, 10 mg/dL, hence the lesser sample size will be required to find the statistically significant effect. Thus, if a study is planned with inappropriate sample size that gives negative results, the no significant difference could be due to true negative results or because of small sample size. Several negative studies are reported to have smaller sample size, these are termed as “underpowered studies.” Such studies might not contribute to the evidence-based medicine.3,4
When to Calculate Sample Size?
It should be calculated when the protocol for study is being prepared as it helps in determination if the study is feasible, ethical, and scientifically sound.
Steps for Sample Size Calculation
-
Formulation of research question:
An adequately formulated research question will have information about the Population under investigation, Intervention, Control group, and the Outcome measures (PICO).
Example, in patients with novel coronavirus disease 2019 (COVID-19) whether drug A compared with drug B reduces the days of hospital stay. Here, as per PICO, “P” is COVID-19 patients, “I” is drug A, “C” is drug B, and “O” is number of days of hospital stay.
-
Stating the null and alternative hypothesis:
The null (H0) and alternative hypotheses (H1) are concise statements of possible versions of “truth” about the relationship between the predictor of interest and the outcome in the population. The null hypothesis is used to state a lack of association between the predictor and the outcome; the alternative hypothesis states the existence of an association between predictor and the outcome. For example, your research question is : If the birth weight of neonates born to women consuming tobacco during pregnancy is less than those born to women not consuming tobacco during pregnancy?
In this example, according to H0 the birth weight of neonates born to women consuming tobacco in pregnancy is similar to neonates born to women not consuming tobacco in pregnancy.
According to H1 the birth weight of neonates born to women consuming tobacco in pregnancy is less than neonates born to women not consuming tobacco in pregnancy.
-
Choosing the primary outcome and suitable statistical test applicable:
The sample size calculation is usually based on the primary objective of the study. Sample size determination is also related to the selection of the statistical test for data analysis as the calculation of sample size may also be based on the statistical tests that will be used for data interpretation.
-
Selecting significance level and power of study:
Discussed in “Prerequisites for Sample Size Calculation“ section of the article.
Calculating sample size manually using formulas or with statistical software.
Prerequisites for Sample Size Calculation
Most of the novice researchers often choose sample size based on the convenience, for example, if an orthopaedician wants to know the prevalence of osteoarthritis in a particular city. He or she will include all patients visiting his/her hospital in particular duration, for example, in 2 months. The issue with this selection of population that the patients of osteoporosis visiting that particular hospital may not be true representative of that city as there are many other hospitals in the city with more patients of orthopaedics visiting there.
The most common question that a researcher wonders about is what should be the adequate sample size to do a study? As mentioned earlier, for determining the sample size various statistical formulas are used. Application of these formulas in sample size will require predetermined information regarding these four components. ►Table 1 shows how to establish these components for sample size calculation.
| Sr. no. | Component | What is it? | Where to find it? |
|---|---|---|---|
| 1 | Type-1 error (α-value) | False positive results due to due to probability of falsely detecting the difference when there is no actual difference (falsely rejecting null hypothesis) | It is usually taken as 0.05 or 0.01 for medical research |
| 2 | Power (1-β) | Probability of correctly rejecting the null hypothesis. It is calculated from type-2 error/β value. Power = 1-β | It is usually taken above 80% for medical research |
| 3 | Effect size | The smallest clinically relevant difference in the outcome | From previous studies, pilot studies or by experience of researcher |
| 4 | Variance/standard deviation | How dispersed or spread out the data values are, i.e., variability in outcome (e.g., Range, interquartile range, and standard deviation) | From previous studies, pilot studies or by experience of researcher |
| 5 | Dropout rate | Anticipated percentage of patients that do not complete the study | From previous studies, pilot studies or by experience of researcher |
Level of Significance/Alpha Value/Type-1 Error
It is popularly known as p-value. It is defined as the probability of falsely rejecting the H0. For example, we are comparing two drugs for lipid lowering efficacy. First group receives drug A and second group receives drug B. Here, the H0 will be that there is no difference in lipid lowering efficacy of these two groups and the H1 will be drug B that is more efficacious than drug A. If for this study, we consider that the p-value of 0.05 is significant, this will mean that we are assuming that there are 5% chances of detection of difference in the efficacy in two groups; when in the reality, there is no difference in efficacy of drug A and drug B at all, that is, the false positive results. For medical research, α-value of 0.05 is used (►Table 1). The matching confidence levels (CI) for the appropriate level of significance are: (1) CI 95% for the 5% (α/p = 0.05) level of significance and (2) CI 99% for the 1% (α/p = 0.001) level of significance.
Power/Type-2 Error
It is defined as the probability of finding the difference in two study groups if it actually exists. It is an essential tool to measure the validity of the study. Power is calculated from another type of error known as β error or type-2 error. Type-2 error detects false negative results which means it fails to detect the difference in two groups when actually the difference exists. The acceptable value of this error should also be decided by the researcher before initiating the study. Conventionally, the acceptable value of β error is 0.20, that is, 20% chances that the null hypothesis is wrongly accepted. Power of study is calculated as 1-β. So, if β is 0.20 then power is 0.8, that is, 80%. Thus, the power could be defined as probability of correctly rejecting the H0. It is usually kept above 80% for medical research (►Table 1).
Effect Size
As described earlier, effect size is the difference in the value of variable in the control group and the test group. If effect size is high, less sample size will be required to prove the effect and if effect size is low, larger sample size will be needed. (►Table 1) The effect size is a numerical value for continuous outcome variables, for example, comparing increases in hemoglobin caused by drug A is 1 dL/mL and by drug B is 5 dL/mL. Thus, the effect size here will be 4 dL/mL. In case of binary outcomes, the difference between the event rate between the two groups should be considered as effect size, for example, the development of anxiety as adverse effect by drug (yes/no), if the difference is 5% between both groups, then the effect size is taken as 5%. Effect size value for sample size calculation is warranted for analytical studies and not for descriptive or cross-sectional studies. Effect size value could be determined from the previously conducted studies, by conducting pilot study, or it could be based on the experience of the researcher.
Variance/Standard Deviation
If the endpoint used for the sample size calculation is quantitative, then this parameter is required for comparative studies. Like effect size, the variance/standard deviation is also identified from the previously conducted studies, by conducting pilot study, or it could be based on the experience of the researcher (►Table 1).
Dropout Rate
Dropout rate is estimation of number of participants who will leave the study due to some reasons. Thus, to compensate for this possible dropouts, some extra patients need to be accommodated in sample size. It is calculated by the formula (►Table 1) mentioned below:
N1=n/(1-d), where N1 is adjusted sample size, n is required sample size, d is dropout rate
The components mentioned above are required for calculation of sample size for almost all types of study designs. Besides these, there could be other parameters required as per study design, for example, for prevalence studies-precision/margin of error, and for clinical trials-pooled prevalence. Details on how to calculate them are given in relevant sections below.
Importance of Pilot Study
As mentioned earlier, for sample size calculation, various components, such as prevalence, variance, effect size, standard deviation, are derived from the previously published literature. Many a times such information is not found on literature search, in such cases pilot studies could be planned. Pilot study is a small-scale study conducted prior to actual large-scale study to assess the feasibility and scientific validity. It also serves a source of information required for sample size calculation for subsequent large study. If the results of pilot study show that the study is not feasible and useful then the idea of conducting larger study could be dropped out. This will help on saving time and resources.5
How to Calculate Sample Size?
There are different formulas for calculation of sample size for different study designs. It is a common mistake of not choosing the right formula as per the study design. In this article, we are explaining in detail about the sample size formula for cross-sectional and clinical trials.
Cross-Sectional Studies
In such studies, data are collected at a particular time to answer questions about the status of population at that particular time. Such studies include questionnaires, disease prevalence surveys, meta-analysis, etc. Cross-sectional studies are also frequently used to show association.6 Cross-sectional studies usually involves estimation of prevalence and estimation of mean.
For estimation of prevalence, the formula used is as follows:

Where Z1– α/2 is the standard normal variate (1.96 at 5% error; ►Table 2), p is the expected proportion in the population, and d is precision. Precision is measure of random sampling error. It is of two types as follows:
| Value | Variance |
|---|---|
| α-Value | Z 1– α /2 (two sided) |
| 0.01 (level of significance 1%) | 2.58 |
| 0.05 (level of significance 5%) | 1.96 |
| 0.10 (level of significance 10%) | 1.64 |
| α -Value | Z 1– α/2 (one sided) |
| 0.01 (level of significance 1%) | 2.33 |
| 0.05 (level of significance 5%) | 1.65 |
| 0.10 (level of significance 10%) | 1.28 |
| β -Value | Z 1– β |
| 0.01 (power 99%) | 2.33 |
| 0.05 (power 95%) | 1.65 |
| 0.20 (power 80%) | 0.84 |
Absolute precision: it refers to the actual uncertainty in a quantity. For example, prevalence of tonsillitis in children is 20 ± 10%, the absolute uncertainty is 10%.
Relative precision: it expresses the uncertainty as a fraction of the quantity of interest. For our example of a prevalence of 20 ± 10%, the relative uncertainty is 10 of 20%, which is equal to 2%.
Conventionally, absolute precision is taken as 5% if the prevalence of disease is expected to be between 10 and 90%. If the prevalence is below 10%, then the precision is usually taken half of prevalence and if the prevalence is expected to be more than 90%, the d is calculated as {0.5 (1-P)}, where P is prevalence.7
For example, a researcher wants to calculate the sample size for a cross-sectional study to know prevalence/proportion of asthma in traffic police in a city, and as per the previously published study, the value of prevalence of asthma in traffic police in the city is around 10%, and the researcher wants to calculate sample size with the absolute precision of 5% and type-1 error of 5%.
Where,
-
Z1–α/2 will be 1.96,
p = 0.10 (percentage converted into the proportion)
d will be 0.05 (Table 2).
Hence by putting the values in the above-mentioned formula, the sample size will be as follows:
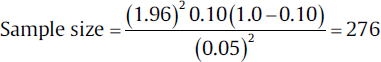
This sample size can be adjusted for the non-response/dropout rate. If nonresponse rate of 10% is expected then as per the formula mentioned under heading “dropout rate” in the earlier text

Where N1 is adjusted sample size, n is required sample size, and d is dropout rate.

So, total of 307 traffic police men need to be screened for asthma for this study.
If the study involves estimation of mean in cross sectional study, then the formula for sample size calculation will be mentioned below:
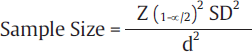
Where, Z1– α/2 is the standard normal variate (1.96 at 5% error; ►Table 2), d is the precision of measurement with respect to the endpoint, and SD is the standard deviation, the value of which needs is extracted from the previously published similar studies, internal pilot study, or from the experienced researchers working in the same area.
For example, estimation of average blood sugar level in last trimester of pregnancy in women with gestational diabetes in a particular region is the study objective. On review of literature, a similar study was found with SD of 30 dL/mL. To calculate sample size based on this value of SD and with precision of 5 dL/mL around the true value of blood glucose in final trimester of pregnancy, when these values are inserted in the formula mentioned above:

Thus, the sample size needed for this study will be 138. It can be adjusted as per the expected dropout rate as mentioned in the previous section.
Clinical Trials
Clinical trial is the type of research that studies new tests and treatments and evaluates their effects on human health outcomes.8
In a clinical trial, the researcher could be calculating either difference between the proportion of two groups or difference between quantitative endpoint, that is the mean between two groups.
If the clinical trial involves estimation of qualitative end point between two groups, that is the difference between proportions, then the formula used for sample size calculation is :
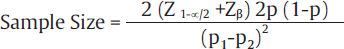
Where value of Z1– α/2 is the standard normal variate is 1.96 at 5% error and Zβ is 0.842 at 80% power (►Table 2).
p1–p2 is the effect size, that is, the expected difference between two groups,
P is pooled prevalence calculated by adding prevalence is group 1 and prevalence in group 2 and then dividing the sum by 2.
As mentioned earlier, the value of effect size and pooled prevalence are calculated from previous studies, pilot study, or experience of researcher.9
For example, one wants to find out the effect of drug A on the mortality in patients with colon cancer. For this study, patients will be divided in two groups. One group will receive test drug A and another group will receive placebo, and the standard drug therapy will be given to both groups.
To calculate the sample size for this study, information required is expected difference between the two groups and the pooled prevalence. On searching literature, it was found that the normal mortality in the standard care treatment is 20%. For drug A, since it is a new drug so the data are not available for mortality, thus by discussions with other researchers working on this, it was decided that a 50% reduction in the mortality can be considered to be clinically significant, and so the expected mortality in drug-A group is taken as 10%. Using these values, the effect size will be 10% (20–10) and pooled prevalence will be 15% (20 + 10/2). On conversion of the percentage to proportions, the effect size will be 0.10 and pooled prevalence will be 0.15. On adding these parameters in the formula, the sample size will be :
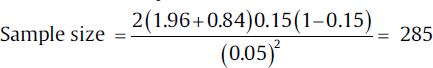
So, the sample size per group for this clinical trial would be 285. This can be adjusted for drop rate as per the method mentioned earlier.
If in clinical trial, the estimation of the difference of quantitative endpoint between two groups is the objective, then the formula used for sample size calculation is:
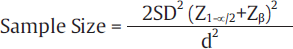
Where, Z1 –α/2 is the standard normal variate is 1.96 at 5% error and Zβ is 0.842 at 80% power (►Table 2).
SD is the difference which is decided based on the previous study or by other means discussed earlier in text.
d is the effect size, that is, the expected difference between the two means which will be based on the previously available data.
For example, a new antidiabetic drug A is to be evaluated for reduction of the fasting blood glucose (FBG) level in comparison to the old antidiabetic drug B. For this study, diabetic patient will be randomly allocated to two groups, one group will be administered new drug A and the other group will receive drug B. Literature of previous similar studies suggest that the reduction of FBG by drug A is 20 dL/mL is more than drug A and the SD of the difference is 50 dL/mL. on entering the values in the formula:
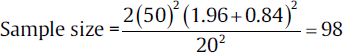
Thus, the sample size needed for this study will be 98 in each group. Sample size may be adjusted to accommodate drop rate by the formula mentioned in earlier sections.
What to Mention in Research/Protocol/Report about Sample Size
Reporting of details of sample size calculation is often disregarded in research protocol, as well as the final research report/article. Contrary to it, is should be mentioned in details so that the authenticity of the sample size is verifiable (►Table 3).
| Type of study | Sample size formula | Interpretation |
|---|---|---|
| Cohort study10,11 | 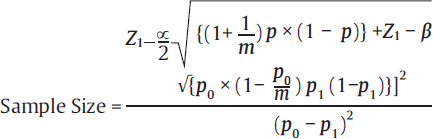 |
• Z1–β = it is the desired power = 0.84 at 80% power • Z1–α/2 is the standard normal variate is 1.96 at 5% error • p0 = possibility of event in controls, from previous studies • p1 = possibility of event in experimental, from previous studies • m = number of control subjects per experimental subject • p = [p1+(m×p0)]/m+1 |
| Case control studies10 | 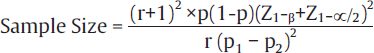 |
• r = control to cases ratio (1 if same numbers of patient in both groups) • p = proportion of population = (P1+P2)/2 • Z1–β = it is the desired power (0.84 for 80% power and 1.28 for 90% power) • It is the standard normal variate is 1.96 at 5% error • P1 = proportion in cases • P2 = proportion in controls |
| Diagnostic tests12,13 | For determining Sensitivity: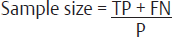 For determining Specificity: 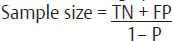
Where: 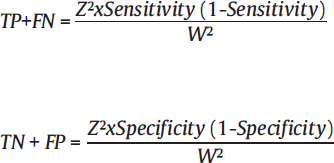
|
• Z is conventionally taken as 1.96 in lieu with 90% confidence interval • P is prevalence of rate of disease in study population • W is maximum acceptable width of 95% CI, is conventionally taken as 10%. *Specificity and sensitivity and p-values are inferred from the previous studies |
| Animal studies14,15 | For one-way ANOVA design (for group comparison: • Minimum number of patients/groups:  • Minimum number of patients/groups: 
|
• k = number of groups • n = number of patients per group • r = number of repeated measurements |
| One within factor, repeated-measure ANOVA (one group, repeated measures): • Minimum number of patients/groups:  • Minimum number of patients/groups: 
|
• N = total number of patients • k = number of groups • n = number of patients per group • r = number of repeated measurements • If the study involves sacrificing of animals then the n should be multiplied by r. |
|
| One between, one within factor, repeated measures ANOVA (group comparison, repeated measurements): • Minimum number of patients/groups:  • Minimum number of patients/groups: 
|
• k = number of groups • n = number of patients per group • r = number of repeated measurements |
Abbreviations: ANOVA, analysis of variance; CI, confidence interval.
The following information should be included in the study protocol for the example 1 mentioned above in the article
“Sample size was calculated based on the previously published study by Charan and Kantharia14 et al in which prevalence of diabetes was 20%. With the absolute precision of 5% points and type-1 error of 5%, the sample size was calculated as 246. After adjusting the sample size for dropout rate of 10%, the final sample size was 274. The sample size was calculated manually by using the formula for cross-sectional studies.”
Thus, the sample size section of the research protocol must contain two references: one for the study from where the prevalence of the disease is derived and another citation from where the formula for the sample size calculation is taken. Beside this, if any software is used for sample size calculation then that too need to be mentioned.
Conclusion
Sample size calculation is one of the important aspects while planning a research and any laxity in its estimation may lead to misleading or incorrect findings. The important factors to be considered during calculation of sample size are: type of study, effect size, type of outcome, variance of outcome, significance level, and the power of test. Sample size calculation requires thorough review of the literature to determine some of the parameters such as prevalence and effect size. Sample size calculations should be explained in detail in study protocol and publication, so that it can be authenticated by anyone.
Conflict of Interest
None declared.
Funding
None.
References
- Methods of sample size calculation in descriptive retrospective burden of illness studies. BMC Med Res Methodol. 2019;19(01):9.
- [CrossRef] [PubMed] [Google Scholar]
- Power analysis, sample size, and assessment of statistical assumptions—improving the evidential value of lighting research. Leukos. 2019;15:143-162.
- [CrossRef] [Google Scholar]
- Targeting next generations to change the common practice of underpowered research. Front Psychol. 2017;8:1184.
- [CrossRef] [PubMed] [Google Scholar]
- The continuing unethical conduct of underpowered clinical trials. JAMA. 2002;288(03):358-362.
- [CrossRef] [PubMed] [Google Scholar]
- Sample size calculation: Basic principles. Indian J Anaesth. 2016;60(09):652-656.
- [CrossRef] [PubMed] [Google Scholar]
- Design and determination of the sample size in medical research. IOSR J Dent Med. 2014;13:21-31.
- [CrossRef] [Google Scholar]
- Practical issues in calculating the sample size for prevalence studies. medical statistics. Arch Orofac Sci. 2006;1:19-14.
- [Google Scholar]
- Clinical trials. Available at: https://www.who.int/health-topics/clinical-trials/#tab=tab_1 (accessed )
- [Google Scholar]
- How to calculate sample size for different study designs in medical research.? Indian J Psychol Med. 2013;35(02):121-126.
- [CrossRef] [PubMed] [Google Scholar]
- How to calculate sample size for observational and experimental nursing research studies? Natl J Physiol Pharm Pharmacol. 2020;10:1-8.
- [CrossRef] [Google Scholar]
- El Ashal G. Part 1: simple definition and calculation of accuracy, sensitivity and specificity. Emergency (Tehran). 2015;3(02):48-49.
- [Google Scholar]
- Sample size calculation guide - part 4: how to calculate the sample size for a diagnostic test accuracy study based on sensitivity, specificity, and the area under the ROC curve. Adv J Emerg Med. 2019;3(03):e33.
- [Google Scholar]
- How to calculate sample size in animal studies? J Pharmacol Pharmacother. 2013;4(04):303-306.
- [CrossRef] [PubMed] [Google Scholar]
- Sample size calculation in animal studies using resource equation approach. Malays J Med Sci. 2017;24(05):101-105.
- [CrossRef] [PubMed] [Google Scholar]