Translate this page into:
Genetic Basis of Diabetic Nephropathy
GEN. AMIR CHAND ORATION delivered during NAMSCON 2016 at the All India Institute of Medical Sciences, Raipur.
Correspondence : Prof. O. P. Kalra, Vice-Chancellor, Pt. B.D. Sharma University of Health Sciences, Rohtak (Haryana), India, Tel : +91-1262-272812, Fax : +91-1262-272811, E-mail : vicechancellor.uhsr@gmail.com, opkalra1@yahoo.com.
Abstract
It is well known that all patients with Type 2 Diabetes Mellitus (T2DM) do not develop chronic kidney disease (CKD). Several metabolic, hemodynamic and intracellular mechanisms have been proposed to play role in the pathogenesis of Diabetic Nephropathy (DN). Clustering of patients with DN in certain ethnic groups and families suggests the role of genetic factors. We have studied various facets about genetic determinants which may influence the development of kidney disease in patients with T2DM.
We have found that Angiotensin Converting Enzyme (ACE) DD genotype conferred the maximum risk, whereas ACE II genotype seemed to confer protective role against development of diabetic and nondiabetic CKD. Further, we found that oxidative stress (OS) plays a significant role in the development of DN and that Glutathione S-transferase theta-1and/or Glutathione S-transferase Mu-1 null genotypes are associated with higher OS in patients with DN. In addition, we also found that increased levels of inflammatory mediators, i.e. Tumor necrosis factor-α (TNF-α), high-sensitivity C-reactive protein (hsCRP) and Urinary Monocyte Chemoattractant Protein-1 (uMCP-1) play a significant role in contributing to OS. We have shown that genetic polymorphism of NF-kB gene and TNF-α gene plays a role in determining serum level of various inflammatory markers and oxidant stress parameters. We found significant association of -429T/C and Gly82Ser Receptors for Advanced Glycation End-products (RAGE) polymorphisms with the development of macrovascular and microvascular complications, respectively in T2DM subjects. Further, we have observed that AGE-mediated exacerbation of RAGE expression may play a role in pathogenesis of various vascular complications in T2DM.
To conclude, polymorphisms of various genes involved in renin-angiotensin aldosterone system (RAAS), inflammatory, oxidant stress, cytoprotective and nitrous oxide pathways and enhanced RAGE mRNA expression may adversely influence final common pathway through oxidant stress mechanisms, and influence the levels of various cytokines and intracellular signaling mechanisms, thereby influencing the susceptibility of patients with diabetes mellitus for development of kidney disease and vascular complications.
Keywords
Diabetic nephropathy
genetic factor
chronic disease.

Introduction
Diabetes Mellitus (DM) has become a leading cause of morbidity and mortality and is considered a major public health problem that places a significant burden on global healthcare resources. It is, however, much less appreciated that the diabetes epidemic would also be accompanied by an epidemic of Chronic Kidney Disease (CKD), which brings with it a huge burden of Cardiovascular Disease (CVD) and End-stage Renal Disease (ESRD), leading to premature death. It is estimated that the number of people with diabetes will rise from 171 million in 2000 to 366 million in 2030, resulting in millions of new cases of CKD, most of them being in the developing world (1). Approximately one-fourth to one-third of all diabetics go on to develop Diabetic Nephropathy (DN), making it one of the leading cause of CKD and ESRD requiring renal replacement therapy (2,3). Recent data from CKD Registry of India shows that DN accounts for the single largest group of patients with CKD (4). Since treating ESRD is simply unaffordable for most developing countries, the emphasis has to be on prevention, early detection and slowing of progression from early stages of CKD to ESRD.
Despite relentless research, the complex etiopathogenesis of kidney disease in DM has not been fully understood. The pathogenesis of DN is clearly multifactorial and several metabolic, hemodynamic and intracellular mechanisms or factors have been proposed to play a role in the onset and progression of disease (5), and are currently under active investigation at various centres all over the world. In addition, certain hereditary and environmental factors have been implicated in the etiopathogenesis of DN. During the last few years, we have focused our research into various genetic factors which may be potentially associated with the development of nephropathy in patients with Type 2 diabetes mellitus (T2DM).
Predictors for Development of Nephropathy in DM
There are various factors which play a role in the development of nephropathy in DM. The most well-known amongst these include poor glycemic control, family history of diabetes or hypertension, increased activity of sodium-lithium counter-transport mechanism in red blood cells, etc. Of these, most of the studies have focused on the role of glycemic control in the development of various complications. Studies done in Type1diabetes mellitus (T1DM), such as Diabetes Control and Complications Trial (DCCT) have shown that tight glycemic control using multiple insulin injections reduces the incidence of microalbuminuria by 39% (6). Similarly, in United Kingdom Prospective Diabetes Study (UKPDS), a 30% risk reduction for the development of microalbuminuria was observed in the group intensively treated for hyperglycemia (7). In the Kumamoto Study, intensive glycemic control reduced the rate of micro- and macroalbuminuria (8). However, it is pertinent to note that in these studies several patients developed DN despite tight glycemic control and vice versa. In a cross-sectional survey of 507 patients with T2DM, we found that self-efficacy was the single most important determinant of current diabetes control (p<0.01) and self-efficacy was influenced by various factors, such as educational status, employment, family support and mental attitude (9). Previously, it was believed that once albuminuria had become persistent, glycemic control lost its beneficial effect on the kidney, but several recent studies have documented the importance of glycemic control on the progression of nephropathy in patients with T1DM. Among the most important putative promoters of progression of kidney disease, blood pressure has been documented to have a close relation with rate of decline of glomerular filtration rate in both T1DM and T2DM. Serum cholesterol concentration has been shown to be another predictor of progression of nephropathy in both types of diabetes. Dietary protein restriction retards the progression of renal disease in diabetes while smoking has been suggested to play a role in the progression of nephropathy in both types of diabetes.
Hereditary and Ethnic Factors
Present day knowledge states that specific genetic backgrounds might influence the development of DN. Indeed, only 30% patients with T1DM and 40% patients with T2DM develop DN irrespective of treatment for diabetes (10), and DN often shows a familial clustering in siblings with diabetes. It has been noted that the prevalence rates of DN in subjects with T2DM show a marked ethnic variation. Higher rates of diabetic renal disease are seen in Indo-Asians in the UK, in African-Americans (11), in Nauruans (12) and Pima Indians (13). The reason for this inter-racial difference in the incidence of DN is unclear, but ethnic variation in genetic susceptibility to nephropathy is a possibility. It is noteworthy that these ethnic groups not only have a very high incidence of T2DM, but also a high incidence of hypertension. This suggests that differences in genetic predisposition to hypertension may contribute to the higher prevalence of nephropathy in certain racial groups; although an alternative explanation may be that the presence of hypertension may accelerate an already present renal disease and lead to the condition becoming clinically manifest more quickly.
Rationale for Genetic Studies in DN
The fact that, a fairly large number of patients with DM goes on to develop nephropathy even in the absence of various factors mentioned above, has led scientists to postulate and investigate various genetic factors leading to this dreadful complication. There is enough evidence supporting the concept of genetic susceptibility to nephropathy in patients with diabetes (14,15). Discovery of genetic variants that underpin susceptibility to nephropathy could yield important insights into this condition. Firstly, it would permit identification of patients at risk of nephropathy shortly after diagnosis of diabetes rather than much later when persistent microalbuminuria develops, by which time there is already histological evidence of renal injury. This would facilitate targeted therapeutic interventions aimed at primary prevention rather than secondary treatment of established nephropathy. Secondly, and perhaps more importantly, if the susceptibility variants are located in genes that have not previously been implicated in DN, this may lead to improved understanding of its pathophysiology and development of targeted novel therapies.
Strategies for Identifying Susceptibility Genes
The etiology of DN is multifactorial, yet there is clear evidence of genetic basis. Strong association of familial aggregation and the heritability of DN in patients with T2DM provide compelling evidence that DN and its related traits are influenced by genetic factors and suggest a complex, multifactorial mode of inheritance with one or more major susceptibility genes. Familial clustering of renal disease in T2DM supports the hypothesis that the increased risk of DN in T2DM is partly due to a shared gene or set of genes among affected family members and has motivated investigations aimed at identifying the specific chromosomal regions that harbor genes contributing to its susceptibility. The major approaches that are currently being used to identify DN susceptibility genes are:
(i) Candidate gene approach, (ii) Linkage analysis, and (iii) Genome-wide association studies.
The Candidate Gene Approach
The candidate gene approach involves assessment of genetic variation, typically Single Nucleotide Polymorphisms (SNPs) in one or more genes with plausible physiological roles in DN. These SNPs lie within a candidate gene or region and are selected from the literature or from the Hap Map database (www.hapmap.org). The goal is to demonstrate a significant difference in allele frequencies between cases with DN and control subjects. In various studies done in our laboratory at University College of Medical Sciences, Delhi, in the field of DN, we have followed the candidate gene approach. A large number of candidate genes involved in several pathways have been tested for association with the development and progression of DN based on the possible physiological role of the genes in patients with DM and kidney disease, such as, reninangiotensin aldosterone system (RAAS), glucose metabolism, growth factors, oxidative stress (OS), inflammation, lipid metabolism, etc.
Several candidate gene studies involving the above-mentioned genes to study the association with DN have been reported; however, the results have largely been inconsistent. Limitations of this approach include that candidate gene studies are frequently based on small number of cases and controls resulting in underpowered analyses. Various meta-analyses are being carried out to overcome the limitations of individual candidate gene study. Various candidate genes which we have studied belonging to different classes are discussed below:
A. Genes Involved in RAAS
RAAS has been shown to play a central role in the pathogenesis of most forms of CKD. Prorenin, renin, Angiotensin-Converting Enzyme (ACE) and angiotensin II levels are all noted to be elevated in DN (16). Furthermore, genes of the RAAS have been suggested as being genetic determinants for both hypertension and CVD, both of which are common in patients with DN.
Polymorphism of ACE gene has been implicated in determining the blood level of ACE and thereby may play an important role in the pathogenesis of DN. Initially we did a pilot study to investigate the prevalence of polymorphisms of ACE genotype in 100 subjects including patients with T2DM with/without DN, patients with non-diabetic CKD and healthy controls (17). We found that D allele of ACE gene acts as a risk factor for the development of nephropathy in patients with T2DM as well as for nondiabetic CKD, while I allele of ACE gene was protective in nature.
Few other investigators have studied ACE gene insertion-deletion polymorphism in DN patients with T2DM (18). A large meta-analysis found the association of ACE D allele with DN risk with an odds ratio (OR) in the range of 1.25–1.57 in the Asian subgroup (19); however, no significant effects were detected for the Caucasian subgroup. In DN, two small studies have suggested an association between the D allele of the ACE gene and nephropathy (20,21); however, other subsequent large studies with and without nephropathy have shown no association between nephropathy and the D allele (22). Overall, the cumulative results from a large number of studies suggest that if the ACE gene has any effect, it is likely to be small, and it is not useful as a screening marker for nephropathy.
In an ongoing study on 'Role of genetic polymorphisms of RAAS on the reno-protective efficacy of ACE inhibitors in patients with DN', we are studying various genes involved in RAAS, viz., ACE (I/D), angiotensinogen (AGT M235T) and angiotensin type I receptor genes in 255 patients of T2DM with nephropathy. Genotype frequency for ACE I/D polymorphism was II-36.7%, ID-50.0%, DD-13.3% and allele frequency was found to be I-61.7% and D-38.3%. We found that ACE inhibitor treatment in patients with DN resulted in significant reduction in urinary protein excretion which was found to be independent of ACE I/D and AGT M235T polymorphism (23).
All the patients have been put on ACE inhibitor therapy and are being followed-up at three-month intervals for a period of minimum two years alongwith monitoring of albumin: creatinine ratio and estimated GFR to assess whether the gene polymorphism of RAAS can modulate the degree of beneficial response seen following ACE inhibitor therapy in preventing the progression of DN.
B. Genes Involved in Inflammatory Pathways
Association of biomarkers of inflammation with the risk of chronic kidney disease in T2DM
Traditionally, DN has been considered a nonimmune, degenerative disease; however, in 1991, Bohle et al (24) described the presence of monocytes, macrophages, T-cells, and fibroblasts associated with the tubulo-interstitial changes seen in DN. More recent reports (25, 26) have suggested that inflammation may underlie disease progression in DN. The activation of Nuclear Factor kappa B (NF-kB) - linked regulatory pathway generally underlies inflammatory processes, and an increase in the nuclear translocation of NF-kB has been demonstrated in human DN (27, 28). Polymorphism of NF-kB1 gene may influence activation / inactivation of NF-kB1 in renal cells which may influence urinary monocyte chemoattractant protein-1 (uMCP-1) levels in patients with DM (29, 30).
Recent evidence has highlighted the role of uMCP-1 in DN and showed it as a major factor influencing macrophage accumulation in renal disease. MCP-1 is a member of the CC chemokine family which is produced by endothelial cells, vascular smooth cells, keratinocytes, fibroblasts, mesangial cells, tubular epithelial cells, lymphocytes and monocytes/macrophages in response to a variety of pro-inflammatory stimuli. It is the strongest known chemotactic factor for monocytes and is upregulated in DN. Its expression has been identified in kidney diseases which involve significant inflammation (31-34). We recruited 150 subjects which were divided into 3 groups having 50 subjects in each group, viz; Group: I- Healthy Controls (HC), Group: II- Patients with T2DM without nephropathy (DM), Group: III- patients with T2DM with nephropathy (DM–CKD) in pre-dialysis stage (35) (Table 1). We have observed that increased level of inflammatory mediators such as TNF- α, hsCRP and MCP-1 may play independent as well as interdependent roles by influencing intracellular signalling which may contribute to hyperglycemia-mediated increase in inflammation and lead to development and progression of DN (35-39).
| Parameters | Group I (HC) (n = 50) |
Group II (DM) (n = 50) |
Group III (DM - CKD) (n = 50) |
|---|---|---|---|
| TNF-α (pg/mL) | 14.5 ± 5.2 (13.1–16.1) |
15.3 ± 3.7 (14.3–16.4) |
20.6 ± 3.9 (19.5– 21.8) |
| hsCRP (mg/L) | 0.74 ± 0.46 (0.61–0.88) |
3.6 ± 1.5a (3.3–4.1) |
8.5 ± 1.7 (8.0–9.0) |
| uMCP-1 (pg/mg creatinine) |
124.1 ± 46.6 (76.3–171.7) |
278.5 ± 125.0 (153.1– 400.8) |
5632.7 ± 2275.8 (3351.5–8001.2) |
Abbre: Group I- Healthy controls (HC), Group II- Diabetes mellitus (DM), Group III- Diabetes mellitus with CKD (DM-CKD). Tumor necrosis factor-alpha (TNF- α), High sensitive C-reactive protein (hsCRP),Urinary monocyte chemoattractant protein-1 (uMCP-1)
NF-kB1, which encodes for p105 subunit, that is ultimately processed to p50 subunit. TNF-α is a pro-inflammatory cytokine and both TNF-α and p85/p50 heterodimer (NF-kB) have been implicated in the pathogenesis of DN. We studied various genotypes (ins/ins, ins/del, del/del) of -94ins/del NF-kB1 gene to find their association in influencing the susceptibility of patients with DM to develop kidney disease. We studied NF-kB1 gene polymorphism in a total of 200 subjects which were divided in four groups of 50 subjects each: Group I-Healthy controls (HC), Group II- Diabetes mellitus (DM), Group III – DM with CKD (DM-CKD) and Group IV–Non-diabetic CKD (Non-DM-CKD). We observed that ins/del NF-kB1 genotype was present in highest number of subjects among all study groups except in patients with DM-CKD, where highest prevalence was of ins/ins genotype (Fig.1).
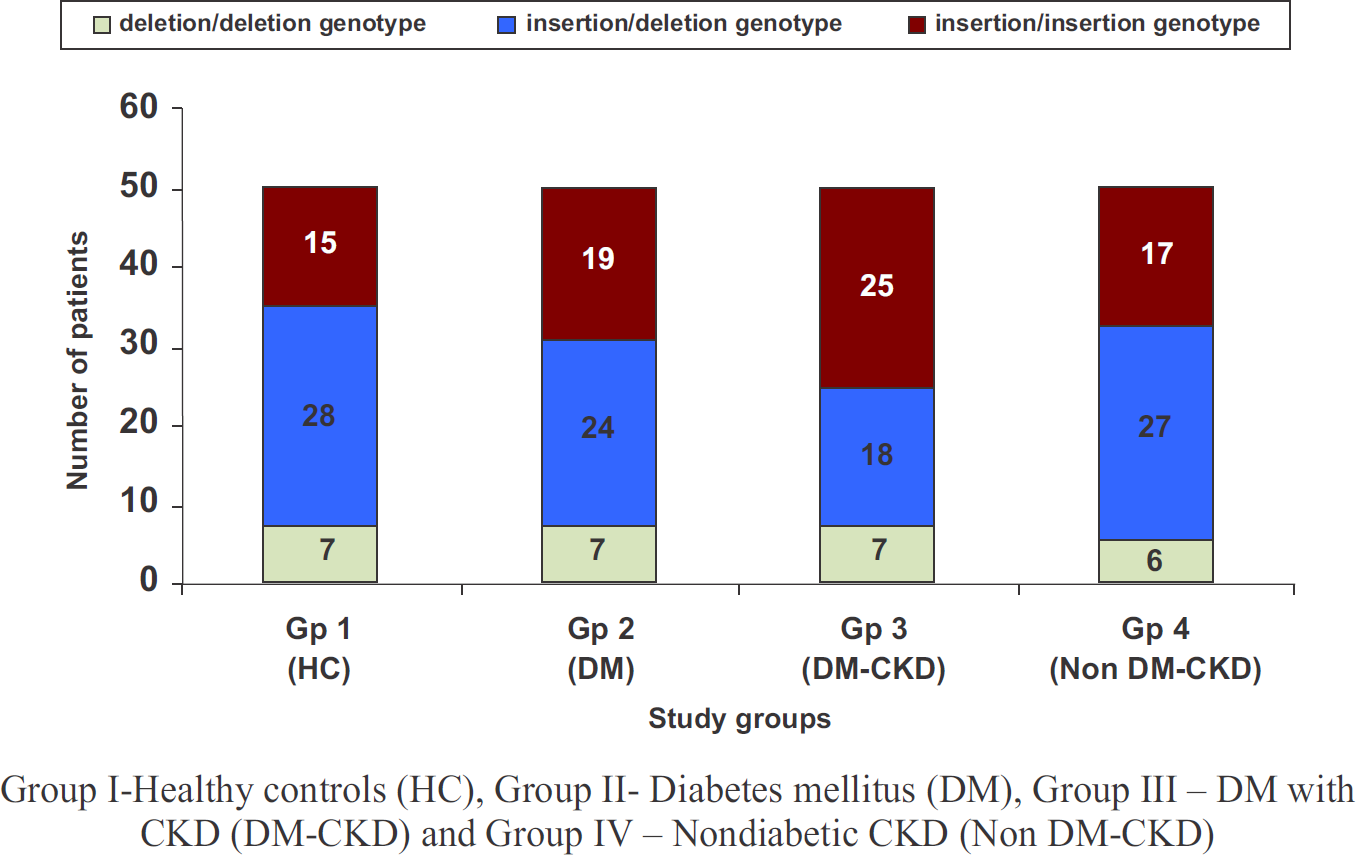
- Distribution of various genotypes of-94 insertion / deletion ATTG polymorphism of NF-kB1 gene in study groups
We also measured uMCP levels in these patients and found that these levels were significantly higher in patients of DM-CKD group as compared to HC and DM (p<0.001). These were also significantly higher than non-DM-CKD group (p<0.001). Further the patients with ins/ins NF-kB1 genotype had the highest level of uMCP suggesting the role of inflammatory pathway in pathogenesis of DN (Fig. 2).
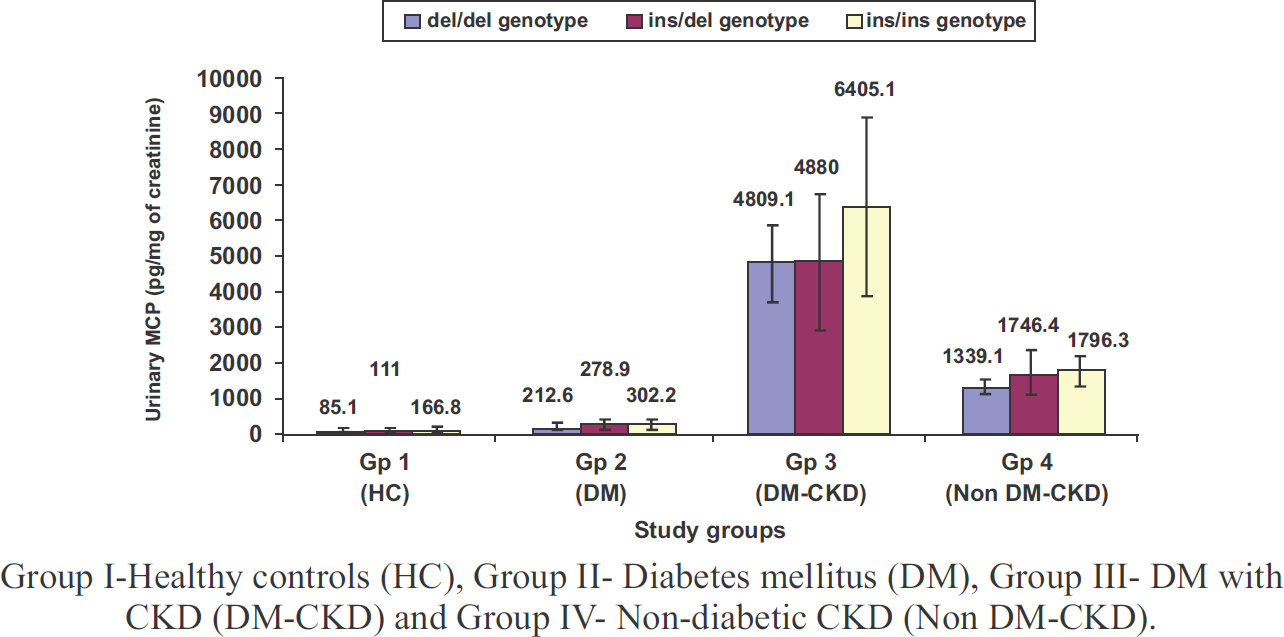
- Urinary MCP-1 levels in relation to different NF-kB1 genotypes in various study groups
Association of TNF-α promoter polymorphisms with plasma TNF-α levels and susceptibility to DN
TNF-α is a pro-inflammatory cytokine which plays an important role in the pathogenesis of various inflammatory diseases including DN. Therefore, we evaluated the association of -863C/A (rs1800630) and -031T/C (rs1799964) polymorphisms in the promoter region of TNF-α gene with plasma TNF-α levels among patients with T2DM with and without nephropathy.
We found that the allele frequencies of -863C/A were 0.86/0.14 in HC group, 0.72/0.23 in patients with T2DM and 0.84/0.16 in DN, and that of -1031T/C were 0.89/0.11 in HC, 0.95/0.05 in T2DM and 0.80/0.20 in DN. We found that total TNF-α levels were significantly higher in patients with DM-CKD as compared to patients with DM without nephropathy and HC. The carriers of -863A allele had significantly lower plasma TNF-α levels (p<0.05); however, no significant association was observed between -1031T/C polymorphism and TNF-α levels (Table 2). We concluded that -63C/A polymorphism was found to be protective; whereas -1031T/C allele may be associated with increased risk for DN in T2DM patients from North India.
| Groups | Gp I(HC) (n=100) | Gp II(DM) (n=100) | Gp III(DM-CKD) (n=100) | p-value |
|---|---|---|---|---|
| Total | 14.57±5.23 | 15.34±3.78 | 20.67±3.98a,b | |
| -863 C→A | ||||
| C/C C/A A/A |
15.38±5.45 13.75±4.85 9.75±1.06 |
16.06±4.40 20.19±5.28 18.62±0.17 |
21.08±3.70 14.75±2.88 13.66±3.32 |
<0.010 F-ratio=13.97 df=2 |
| -1031T→C | ||||
| T/T Non T/T |
14.31±5.16 15.37±5.62 |
15.18±3.91 16.76±1.94 |
19.44±3.60 23.29±3.52 |
0.104 F-ratio=1 df=4.71 |
Values are given as mean ± SD Non T/T= T/C+C/C Data are expressed as mean±SD. ap< 0.001 vs HC; bp<0.001 vs DM Abbre: Healthy Controls – HC, Diabetes Mellitus – DM, Diabetes mellitus with chronic kidney disease –DM-CKD.
C. Genes Involved in OS Pathway
Few studies have shown that OS might play an important role in the pathogenesis of CKD. The OS is also considered to be the final common pathway for the development of diabetic complications including nephropathy. Several factors are responsible for the regulation of the balance between pro-oxidants and antioxidants in the body. We measured OS parameters in patients of T2DM with and without nephropathy and compared these with HC. We enrolled 50 patients in each group. We found that antioxidant parameters like reduced Glutathione (GSH) and Ferric Reducing Ability of Plasma (FRAP) were lower in patients with DM and DM-CKD as compared to HC (Table 3). The decrease of these parameters was more severe in patients with DM-CKD. Further, oxidant stress parameters like Malondialdehyde (MDA) were raised in DM-CKD.
| Parameters | Group I (HC) (n = 50) |
Group II (DM) (n = 50) |
Group III (DM - CKD) (n = 50) |
|---|---|---|---|
| GSH (mg/g Hb) | 3.37 ± 0.35 (3.20–3.50) |
1.89 ± 0.06 (1.70– 1.80) |
0.90 ± 0.01 (0.97–0.98) |
| FRAP (μmol/L) | 549.6 ± 49.1 (535.6– 563.6) |
409.0 ± 55.1 (399.5– 451.8) |
170.7 ± 142.3 (166.6– 231.4) |
| MDA (nmol/mL) | 1.48 ± 0.20 (1.40–1.50) |
2.60 ± 0.35 (2.50–2.70) |
5.14 ± 0.39 (5.00–5.20) |
Abbre: Glutathione (GSH), Ferric Reducing Ability of Plasma (FRAP), Malondialdehyde (MDA)
Further, we found that there was significant correlation between markers of OS and inflammation in patients of T2DM with/without nephropathy in all subjects (35). Similarly, parameters of antioxidant activity such as reduced GSH and FRAP showed negative correlation with inflammatory markers (p < 0.001 for both).
Role of glutathione S-transferase M1 and T1 gene polymorphism in patients with DN
The glutathione S-transferases (GSTs) (EC 2.5.1.18) belong to a family of ubiquitous and multifunctional enzymes that work as one of the endogenous antioxidants through their ability to catalyze the conjugation of reduced GSH with electrophilic compounds and through their GSH peroxidase activity. Hence, reduced GST expression may result in diminished capacity of defense against OS. Interestingly, an earlier study has documented over-expression of GSTs in erythrocytes of CKD patients pointing to the fact that this group of enzymes might be involved in the pathogenesis of CKD (40). The mechanism by which GST polymorphism leads to CKD is not well-understood. In a previous study, Hayek et al (41) have shown that GSTT1 null genotype is associated with increase in markers of lipid peroxidation among diabetics.
In the last few years, there has been a surge of reports studying the association of DN with the genetic polymorphisms of GST. Although no association of GSTM1 deletion has been found with DN in Japanese T2DM patients (42), GSTT1 null genotype has been shown to be a risk factor for development of DN in the Chinese (43). In the Korean population (44), GSTM1 null genotype is found to be associated with nephropathy in T2DM patients. Ours is the first study regarding the association of GST polymorphism with DN in Indian population.
We investigated the role of the GST polymorphisms in determining variation in susceptibility of individuals to CKD and to pinpoint the probable underlying mechanism (45, 46). A total of 200 subjects were enrolled under four study groups, viz., (i) Healthy subjects, n = 50; (ii) Patients of T2DM for at least 10 years without any microalbuminuria or overt proteinuria, n = 50; (iii) Patients of T2DM with nephropathy (DM-CKD), characterized by the presence of microalbuminuria or overt proteinuria, n = 50; (iv) Patients with nondiabetic CKD (NDM-CKD) having evidence of overt proteinuria and/or deranged renal function for more than 3 months in the absence of DM and any systemic or local infection, n = 50. We found that GSTM1 and GSTT1 deletions singly or together were associated with lower GST levels and higher OS in both diabetic and nondiabetic CKD. Interestingly GSTT1 deletion appears to be associated with both diabetic and nondiabetic CKD irrespective of the GSTM1 status.
Role of GSTM1 and GSTT1 genotypes in the development of OS in patients with DN
In another study, we investigated whether the deletion of GSTM1 and GSTT1 genes are associated with higher OS in DN patients and the possible role of these polymorphisms in the development of DN (47, 48). We recruited 60 patients having T2DM for more than 5 years with albuminuria >300 mg/day and having evidence of diabetic retinopathy. In all these patients genotypic analysis was done by using multiplex polymerase chain reaction (PCR). Various OS parameters which were studied included GST activity, MDA and GSH. The prevalence of different genetic polymorphisms of GST in patients with DN was: GSTM1 positive -32 (53.4%), GSTM1 null – 28 (46.6%), GSTT1 positive – 27 (45%), GSTT1 null – 33 (55%), Both null – 18 (30%) and Both positive – 17 (28.3%).
Further, our study showed that double deletion involving GSTT1 and GSTM1 may result in decreased GST levels, leading to increased OS which may result in greater risk for development of DN. The levels of different OS parameters in various GST genotypes are given in Table 4.
| GST (nmol/min/mg protein) | MDA (nmol/mL) |
GSH (μmol/dL) |
|
|---|---|---|---|
| GSTM1 null(n = 28) | 0.95 ± 0.16 | 5.29 ± 0.89 | 142.1 ± 26 |
| GSTT1 null(n = 33) | 0.98 ± 0.17 | 5.17 ± 1.14 | 143.4 ± 33.3 |
| Both null(n = 18) | 0.87 ± 0.11a,b | 5.84 ± 0.6 a’b’c | 130.6 ± 34a |
| Both positive(n = 17) | 1.27 ± 0.12 | 4.28 ± 1.19 | 173.9 ± 24.5 |
“Significantly different from both positive group at p<0.05,
bsignificantly different from GSTT1 null group at p<0.05,
csignificantly different from GSTM1 null group at p<0.05 (ANOVA with Tukey SD as post-hoc test)
GST levels in patients with T2DM with and without nephropathy
Hyperglycemia induced OS is implicated as a contributor to the onset and progression of T2DM and its complications like DN. GST is primarily involved in the neutralization of Reactive Oxygen Species (ROS) by enzymatic conjugation with the scavenger peptide GSH (49-51). In another study, we evaluated the role of GST along with OS markers and their correlation in patients with T2DM with and without nephropathy. We have recruited 300 study subjects divided into three groups of 100 each: HC, DM and DM-CKD. Plasma GST, MDA, reduced GSH levels and FRAP were estimated spectrophotometrically.
GST levels were found to be raised in the patient groups in comparison to HC, however, the highest significant levels were seen in T2DM as compared to DM-CKD (p<0.05). Other oxidant and antioxidant markers are shown in Table 5. The antioxidant parameters including GSH and FRAP were significantly lower in DN as compared to T2DM and HC (p<0.05). Higher lipid peroxidation was seen in patients of DM-CKD as MDA levels were significantly raised when compared to T2DM and HC (p<0.05). We found negative correlation between HbA1c and GSH (r= -0.942, p<0.01) and FRAP (r= -0.854, p<0.01). A positive association was observed between HbA1c and GST (r= 0.606, p<0.01) and MDA (r= 0.839, p<0.01); however, a significant negative correlation between GST activity and GSH levels (r= -0.530, p<0.01) and FRAP (r= -0.294, p<0.01) was observed. GST activity was positively correlated with MDA levels (r= 0.253, p<0.01).
| Parameters | Group I (HC) |
Group II (DM) |
Group III (DM-CKD) |
|---|---|---|---|
| (n=100) | (n=100) | (n=100) | |
| GSH (mg/g Hb) | 3.2±0.2 (3.0-3.9) |
1.7±0.2a,c (1.0-1.9) |
0.85±0.1a,b (0.12-1.1) |
| GST (nmol/min) | 6.3±0.6 (4.1-7.8) |
8.6±0.5a,c (7.6-10.2) |
7.5±0.3a,b (6.25-8.1) |
| MDA (nmol/mL) | 1.5±0.3 (0.9-2.2) |
2.5±0.3a,c (2.0-3.1) |
5.2±0.5a,b (4.3-6.8) |
| FRAP (μmol/L) | 542.9±54.0 (425-660) |
404.8±48.4a,c (300.8-494.9) |
163±40.2a,b (95.5-335) |
Data are expressed as mean±SD. Group I- Healthy control (HC); Group II- Type 2 diabetes mellitus without nephropathy (DM) Group III- Diabetes mellitus with CKD (DM-CKD)
asignificantly different from healthy control at p<0.05,
bsignificantly different from diabetic patients without nephropathy at p<0.05,
csignificantly different from diabetic patients with nephropathy at p<0.05.
D. Genes Involved in Cytoprotective Pathway
NAD(P)H quinone oxidoreductase 1 (NQO1) plays a prominent role in maintaining cellular homeostasis and is an essential component of the antioxidant defense system. It catalyzes metabolic detoxification of quinines and protects cells against chemical induced OS. Expression of NQO1 increases in response to oxidant and electrophilic radicals to counteract OS, and in fact, it is a kind of cytoprotective defense mechanism for cells.
Genetic association of NAD(P)H Quinone Oxidoreductase (NQO1*2) polymorphism with NQO1 levels and risk of DN
NQO1 catalyzes reactions having cytoprotective effect against redox cycling and OS. A single base polymorphism (C/T) at nucleotide 609 of NQO1 gene impairs the stability and function of its protein (52-54). Its role in the development of DN has not been studied earlier. We evaluated the association of NQO1*2 (rs1800566) polymorphism with plasma NQO1 activity and DN. We have screened 600 study subjects including healthy controls (HC), Type 2 diabetes mellitus without complications (T2DM) and diabetic nephropathy (DN): (200 subjects in each group) for studying NQO1*2 gene polymorphism using the PCR-RFLP. Plasma NQO1 activity was measured by ELISA.
NQO1 activity was significantly increased in both the diseased groups, however, it was highest in T2DM patients (8 times) followed by DN (3.5 times) vs HC group. Correlation between NQO1*2 polymorphism and NQO1 activity in plasma was studied. It was found that in all the genotypes, NQO1 activity was highest in T2DM vs DN as compared to HC where it was the lowest; however, NQO1*1 allele was associated with higher NQO1 activity and NQO1*2 allele with lower activity of NQO1. SNP NQO1*2 is a functional polymorphism since it was seen to influence plasma NQO1 activity and NQO1*2 allele was associated with decreased plasma NQO1 activity (p<0.01) in T2DM, DN and HC (Table 6).
| Groups | Group I (HC) (n=200) |
Group II (DM) (n=200) |
Group III (DN) (n=200) |
p-value |
|---|---|---|---|---|
| NQO1*1/*1 | 4.16±0.47 | 31.36±1.19 | 15.51±0.78 | |
| NQO1*1/*2 | 1.9±0.4 6a | 25.99±0.81a | 11.06±0.67a | <0.05 |
| NQO1*2/*2 | 0.62±0.06a,b | 20.32±1.28a,b | 7.43±0.85a,b |
Plasma NQO1 levels are given as mean±SD. Group I- Healthy Control (HC), Group II- Type 2 Diabetes Mellitus without complications (DM),
Group III- Diabetic Nephropathy (DN)
asignificantly different from homozygous NQO1*1/*1 in study groups at p<0.05
bsignificantly different from heterozygous NQO1*1/*2 in study groups at p<0.05
Among DN and T2DM patients, the OR for the development of DN was 1.72-fold higher in T2DM patients carrying the NQO1*2/*2 genotype than in those carrying NQO1*1/*1 or NQO1*1/*2 genotypes (95% CI=1.133 to 2.600). A significant association was observed for NQO1*2 polymorphism in patients of T2DM when compared to HC (OR=6.638, 95% CI=1.427–30.876, p=0.016). NQO1*2 polymorphism was shown to be associated with an increased risk of DN in comparison to HC (OR=22.00, 95% CI=5.075-95.376, p=0.000). Therefore, it may be concluded that NQO1*2 allele may increase the risk for developing DN in T2DM patients as well as HC.
E. Genes Involved in Nitric Oxide (NO) Pathway
NO is a major regulator of renal hemodynamics, its production being catalysed by endothelial nitric oxide synthase (eNOS). Reduction in the generation of NO acts as a deteriorating factor for progressive renal disease. Polymorphisms in the eNOS gene may alter its expression, thus affecting the production of NO. Familial clustering DN points to a role of genetic factors in the pathogenesis of renal disease.
Hey et al published a meta-analysis of 24 studies and analysed the polymorphisms of eNOS genes (4b/a,G894T and T786C) associated with DN (55). It was found that 4b/a and G894T polymorphisms in the eNOS gene were associated with susceptibility to DN in Asian populations, but not in Caucasian populations. A meta-analysis of 8 studies performed by Zhou et al evaluated the association of G894T gene polymorphism alone with DN susceptibility (56). These studies included 850 cases and 1254 controls. In the Asian population, the average frequency of T-allele was 19.19% in DN patients and 8.68% in controls. A significant association was observed between the presence of T-allele and DN risk in the overall population.
We studied the eNOS G894T polymorphism in patients of diabetes with and without nephropathy and measured the serum NO levels in these patients and compared them in the HCs. It was found that patients with DN add lowest levels of NO (22.02±16.18 μM) as compared to diabetics without nephropathy (63.86 ± 29.49 μM) and HC (38.42 ± 13.71 μM) (p< 0.001). Further a positive association was observed between eNOS G894T polymorphism as the frequency of TT genotype as well as that of mutant T allele was increased in patients with DN as compared to diabetics without nephropathy and HCs (57).
F. Genes Involved in Advanced Glycation End-products (AGE) and its Receptor (RAGE) Interaction
Association of RAGE gene polymorphism with vascular complications in patients with T2DM
Hyperglycemia associated with DM stimulates non-enzymatic glycation and oxidation of proteins and lipids leading to enhanced formation of AGEs. There is growing evidence that production and accumulation of AGEs is involved in the initiation and development of micro-and macrovascular complications observed in DM (58, 59). AGEs bind to specific RAGE which is expressed in many of the cell types such as endothelial cells, monocytes and lymphocytes, including β cells of pancreas (60-62). The gene for RAGE is located on the chromosome 6p21.3 near the HLA locus, and at least 30 polymorphisms have been identified of which 9 are in promoter region, 11 in exon region and 10 in intron region.
Three polymorphisms of RAGE gene namely -374T/A, -429T/C and Gly82Ser have been widely studied with regard to the development of diabetic complications in different populations all over the world. We investigated the association of -374T/A, -429T/C and Gly82Ser RAGE gene polymorphisms and their haplotypes with vascular complications in T2DM patients which may help in identifying DM patients predisposed to possible micro-and macrovascular complications as a result of their genetic makeup (63). A total of 427 patients of T2DM with disease duration > 5 years were enrolled in this study. These patients were divided into three groups. The first group referred to as 'DM' comprised of 140 T2DM subjects without any vascular complications. The second group referred to as 'DM-micro' consisted of 152 T2DM subjects with microvascular complications (retinopathy and nephropathy). The third group referred to as 'DM-macro' consisted of 135 T2DM subjects with macrovascular complications. In addition, 176 HCs were enrolled in the study.
We found that -429T/C and Gly82Ser RAGE polymorphisms were significantly associated with the development of macrovascular and microvascular complications respectively in T2DM subjects while -374A allele showed reduced risk towards the development of macrovascular complications. Further, -429T/C, -374T/A and Gly82Ser haplotype analysis revealed association of CTG haplotype with development of macrovascular complications while haplotype TAG was observed to be significantly protective towards development of macrovascular complications in T2DM subjects (OR = 0.617, p = 0.0202).
G. Gene Expression Studies
Role of AGE-RAGE expression in diabetic vascular complications
Interaction of AGE with its receptor RAGE transduces multiple signals such as NAD(P)H oxidase, Mitogen-Activated Protein (MAP) kinases, extracellular signal regulated kinases, GTPase, etc. (64, 65). Activation of NAD(P)H oxidase causes enhanced Reactive Oxygen Species (ROS) generation which may lead to peroxidation and glycoxidation reactions that results in Protein Carbonyl (PCO) formation, Advanced Oxidation Protein Products (AOPP) generation and lipid peroxidation. These OS markers have been shown to be enhanced significantly in diabetic patients (66, 67). On the other hand, activation of kinases and GTPases causes activation of nuclear transcription factor including NF-kB which transcribes its target genes such as Vascular Cell Adhesion Molecule – 1 (VCAM-1), E-selectin and pro-inflammatory cytokines.
AGE-RAGE interaction is one of the mediators of vascular complications in DM; however, factors that possibly induce exaggerated AGE-RAGE interaction are not well known. RAGE is usually expressed at low levels in adults. Enhanced AGE-RAGE interaction possibly requires increased expression of RAGE. In various diseased states such as CVD, diabetes, inflammation, etc., there is higher expression of RAGE; however, conditions and factors that may induce RAGE expression particularly in T2DM have not been elucidated.
Since AGE formation is an integral phenomenon in T2DM, we investigated the dependence of RAGE expression on circulating AGE level and have examined the outcome of AGE-RAGE interaction by measurement of OS status in those patients (68). We recruited 75 patients of T2DM with disease duration > 5 years for this study. These patients were divided into three groups. The first group referred to as 'DM' comprised of 25 T2DM subjects without any vascular complications. The second group referred to as 'DM-micro' consisted of 25 T2DM subjects with microvascular complications (retinopathy and nephropathy). The third group referred to as 'DM-macro' consisted of 25 T2DM subjects with macrovascular complications. In addition, 25 HCs were also enrolled in the study by voluntary participation.
We observed that serum AGEs levels were significantly higher in diabetic patients having vascular complications as compared to T2DM without complications (p < 0.01) (Table 7). RAGE m-RNA expression level in PBMCs assayed by quantitative real time PCR was four times higher in diabetic subjects without vascular complications while DM patients having microvascular or macrovascular complications showed 12 fold and 8 fold higher RAGE m-RNA expression, respectively, compared to HCs. Further, circulating AGEs levels showed significant positive correlation with RAGE m-RNA expression and OS markers (Fig.3).
| Parameters | DM | DM-micro | DM-macro | Healthy subjects |
|---|---|---|---|---|
| AGE ELISA (μg/mL) | 1.4±0.54 | 3.4±0.95a | 2.32±0.88a | 1.12±0.38 |
| AGE-F (AU) | 1.97±0.43 | 2.68±0.39a | 2.50±0.32a | 1.87±0.29 |
| MDA (nmol/mL) | 0.43±0.15 | 0.76±0.22a | 0.81±0.37a | 0.26±0.06 |
| PCO (nmol/mg protein) | 1.6±0.43 | 2.8±1.0a | 3.0±0.72a | 1.4±0.43 |
| AOPP (μmol/L of chloramines T- equivalent) | 103±27.2 | 163±42.2a | 206±54.2a | 85±21.9 |
Data are presented as mean ± SD.
Comparison between the groups was performed with one-way ANOVA and followed by post hoc Tukey's analysis. ap< 0.05 compared with controls and DM group.
Advanced glycation end-product (AGE), Malonyldialdehyde (MDA), Protein carbonyl (PCO), Advanced oxidation protein product (AOPP), Diabetes mellitus (DM), Diabetes mellitus with microvascular complications (DM-micro), Diabetes mellitus with macrovascular complications (DM-macro).
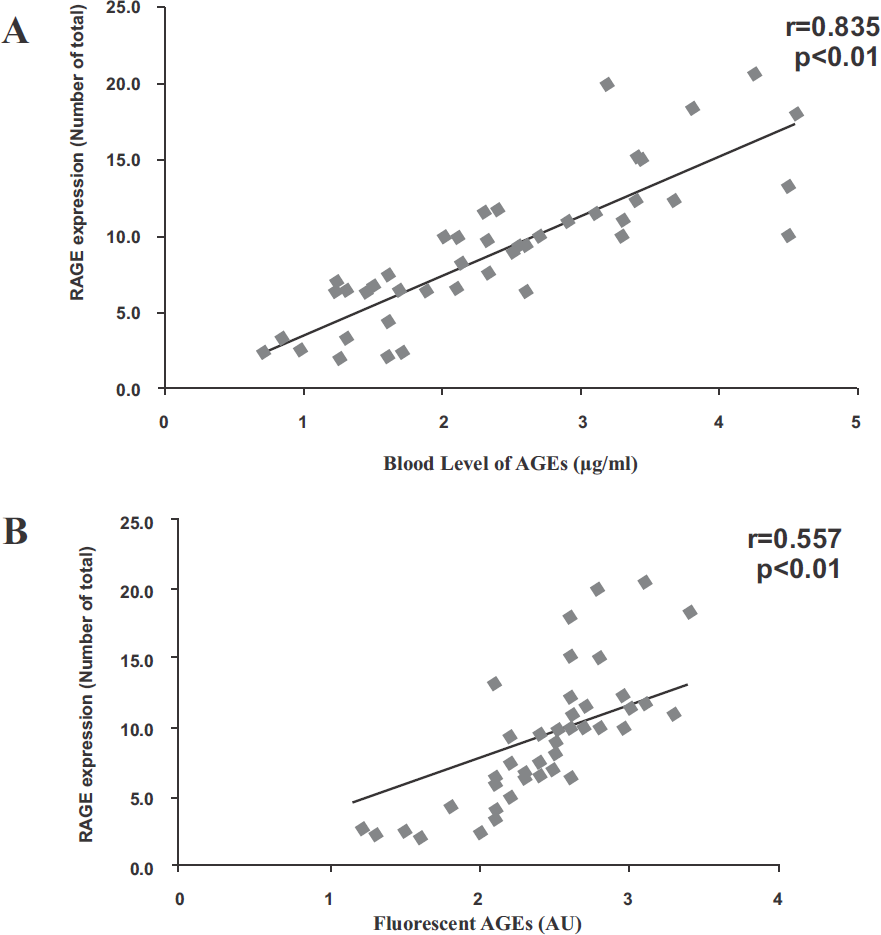
- Circulating AGEs shows significant positive correlation with RAGE m-RNA expression among diabetic subjects. (A) Relationship between circulating AGEs and RAGE m-RNA expression among diabetic subjects. (B) Relationship between fluorescent AGEs and RAGE m-RNA expression among diabetic subjects. Correlation analysis was performed using Pearson's coefficient.
H. Epigenetic Studies
Epigenetics is the study of inherital changes in phenotype or gene expression caused by mechanisms other than changes in the underlying DNA sequence; therefore, non-genetic factors cause the organism's genes to behave differently. There is some evidence to suggest the role of epigenetic factors in the complex interplay between genes and environment. Epigenetic mechanisms include DNA methylation, histone modification and microRNAs. Few studies have suggested that hyperglycemia may induce epigenetic changes of pro-inflammatory genes, which subsequently regulate gene expression and thereby the development of vascular complications (69, 70); however, improved glycemic control for 3 – 5 years at a later stage in diabetic patients did not reduce the risk of macrovascular complications (71, 72). It is possible that the effects of hyperglycemia may be long term and that epigenetic changes induced by hyperglycemia may persist for more than 5 years. Based on the outcome of DCCT trial, it was hypothesized that transient exposure to hyperglycemia may induce sustained epigenetic changes and thereby increased risk of vascular complications over a longer period of time. In fact, a transient exposure to hyperglycemia induces epigenetic changes in the promoter of NF-kB subunit of p65 and subsequently p65 expression and NF-kB actively and these changes persist even after normal glucose is attained.
Key Findings and Summary
There is enough evidence from our studies to support the hypothesis that genetic factors play a crucial role in determining susceptibility of patients with DM for development of nephropathy. We have found that D allele of ACE gene acts as risk factor for the development of nephropathy in patients with T2DM as well as for nondiabetic CKD; whereas I allele of ACE gene was protective in nature. Further, whether ACE gene polymorphism can modulate the degree of beneficial reno-protective effect following ACE inhibitor therapy is currently under investigation in our laboratory. We have found that OS plays a significant role in the development of DN, and that GSTT1 and/or GSTM1 null genotypes are associated with higher OS in patients with DN. In addition, we also found that increased levels of inflammatory mediators i.e. TNF-α, hsCRP and uMCP-1 play an independent as well as interdependent roles, via several signaling pathways contributing to hyperglycemia-mediated increase in OS. We have shown that genetic polymorphism of NF-kB gene and TNF-α gene plays a significant role in determining serum level of various inflammatory markers and OS parameters. An increase in OS may further amplify inflammation, thus setting up a vicious cycle. Therefore, inflammation interlinked with OS may be major mechanisms in the pathogenesis and progression of nephropathy in susceptible diabetic patients. We found significant association of -429T/C and Gly82Ser RAGE polymorphisms with the development of macrovascular and microvascular complications, respectively in T2DM subjects while -374A allele showed reduced risk towards the development of macrovascular complications. Further, we have observed that AGE-mediated exacerbation of RAGE expression may contribute to OS generation that plays a key role in pathogenesis of various vascular complications in DM.
To conclude, polymorphisms of various genes involved in RAAS, inflammatory, oxidant stress, cytoprotective and nitrous oxide pathways may influence the levels of various cytokines and intracellular signaling mechanisms, thereby influencing the suscepti bility of patients with DM for development of kidney disease. In addition, raised AGE and AOPP levels and polymorphisms of RAGE and enhanced RAGE mRNA expression may adversely influence final common pathway through oxidant stress mechanisms, and thereby determine the development of microvascular and/or macrovascular complications in patients with DM.
Acknowledgements
The Author would like to gratefully acknowledge the financial support provided by Department of Biotechnology, Government of India, Indian Council of Medical Research and University Grants Commission, in addition to Intramural Research Grant provided by University College of Medical Sciences, University of Delhi. In addition, immense contribution by the Faculty, PhD students, Postgraduate students and Research Scholars from the Departments of Medicine and Biochemistry (Divisions of Nephrology and Endocrinology and Gene Environment Toxicology Laboratory) is sincerely acknowledged. These include: Prof. SV Madhu, Prof. JK Gambhir, Prof. BD Banerjee, Prof. AK
Tripathi, Prof. S Agarwal, Dr. RS Ahmed, Dr. AK Yadav, Dr. A Raizada, Prof. J Rohatgi, Dr. SK Datta, Dr. A Mehndiratta, Ms. M Siddarth, Ms. S Gupta, Dr. M Sharma, Mr. D. Chawla, Dr. A Gautam, Dr. S Kumar, Dr. R Pathak, Dr. V Kumar, Neerja Aggarwal, P Kare and R Ghosh.
References
- Global prevalence of diabetes: estimates for the year 2000 and projections for 2030. Diabetes Care. 2004;27:1047-1053.
- [CrossRef] [PubMed] [Google Scholar]
- Preventive strategies for diabetic nephropathy. In: Kalra OP, ed. In: Renal Disease - Prevention and Management – A Physician's Perspective (1st). New Delhi: Jaypee Brothers Medical Publishers (Pvt.) Ltd.; 2008. p. :66-67. Chapter 10
- [Google Scholar]
- Preventive strategies for diabetic nephropathy. In: Medicine Update. The Association of Physicians of India. Vol 17. New Delhi: Jaypee Brothers Pvt. Ltd.; 2007. p. :261-272.
- [CrossRef] [Google Scholar]
- What do we know about chronic kidney disease in India: first report of the Indian CKD Registry. BMC Nephrology. 2012;13:1-8.
- [CrossRef] [PubMed] [Google Scholar]
- From hyperglycemia to diabetic kidney disease: the role of metabolic, hemodynamic, intracellular factors and growth factors/cytokines. Endocr Rev. 2004;25:971-1010.
- [CrossRef] [PubMed] [Google Scholar]
- The effect of intensive treatment of diabetes on the development and progression of longterm complications in insulin-dependent diabetes mellitus. N Engl J Med. 1993;329:977-986.
- [CrossRef] [PubMed] [Google Scholar]
- Intensive blood-glucose control with sulphonylureas or insulin compared with conventional treatment and risk of complications in patients with type 2 diabetes (UKPDS 33) Lancet. 1998;352:837-853.
- [CrossRef] [Google Scholar]
- Long-term results of the Kumamoto Study on optimal diabetes control in type 2 diabetic patients. Diabetes Care. 2000;23:B21-B29.
- [Google Scholar]
- Diabetes self-efficacy strongly influences actual control of diabetes in patients attending a tertiary hospital in India. J Community Health. 2012;37:653-662.
- [CrossRef] [PubMed] [Google Scholar]
- Segregation analysis of urinary albumin excretion in families with type 2 diabetes. Diabetes. 2000;49:1057-1063.
- [CrossRef] [PubMed] [Google Scholar]
- Disparities in incidence of diabetic end-stage renal disease according to race and type of diabetes. N Engl J Med. 1989;321:1074-1079.
- [CrossRef] [PubMed] [Google Scholar]
- Prevalence and risk factors for micro- and macroalbuminuria in diabetic subjects and entire population of Nauru. Diabetes. 1989;38:1602-1610.
- [CrossRef] [PubMed] [Google Scholar]
- Familial predisposition to renal disease in two generations of Pima Indians with type 2 (non-insulin-dependent) diabetes mellitus. Diabetologia. 1990;33:438-443.
- [CrossRef] [PubMed] [Google Scholar]
- Genetic determinants of diabetic nephropathy. In: Medicine Update. In: Joshi SR, ed. The Association of Physicians of India. Vol 24.1. New Delhi: Jaypee Brothers Pvt. Ltd.; 2014. p. :663-674.
- [Google Scholar]
- Genetic basis of diabetic nephropathy. In: Medicine Update. In: Muralidhar S Rao, ed. The Association of Physicians of India. Vol 20. New Delhi: Jaypee Brothers Pvt. Ltd.; 2010. p. :695-701.
- [Google Scholar]
- Elevated serum angiotensin converting enzyme activity in type 1, insulin dependent diabetic subjects with persistent microalbuminuria. Acta Diabetol. 1992;29:82-85.
- [CrossRef] [Google Scholar]
- Association of angiotensin converting enzyme gene polymorphism with diabetic nephropathy and non-diabetic chronic kidney disease. Indian J Nephrol. 2010;20(Suppl):S30.
- [CrossRef] [PubMed] [Google Scholar]
- Meta-analysis of the relationship between ACE I/D gene polymorphism and end-stage renal disease in patients with diabetic nephropathy. Nephrology (Carlton). 2012;17:480-487.
- [CrossRef] [PubMed] [Google Scholar]
- Association between genetic polymorphism of the angiotensinconverting enzyme and diabetic nephropathy: a meta-analysis comprising 26,580 subjects. J Renin Angiotensin Aldosterone Syst. 2012;13:161-174.
- [CrossRef] [PubMed] [Google Scholar]
- Genetic predisposition to diabetic nephropathy: Evidence for a role of the angiotensin I-converting enzyme gene. Diabetes. 1994;43:690-695.
- [CrossRef] [PubMed] [Google Scholar]
- Relationships between angiotensin I-converting enzyme gene polymorphism, plasma levels, and diabetic retinal and renal complications. Diabetes. 1994;43:384-388.
- [CrossRef] [PubMed] [Google Scholar]
- Association of ACE gene polymorphism and diabetic nephropathy? Kidney Int. 1995;47:1176-1181.
- [CrossRef] [PubMed] [Google Scholar]
- Role of angiotensin converting enzyme and angiotensinogen gene polymorphisms on angiotensin converting enzyme inhibitor-mediated antiproteinuric action in type 2 diabetic nephropathy patients. World J Diab. 2017;8(3):112-119.
- [CrossRef] [PubMed] [Google Scholar]
- The pathogenesis of chronic renal failure in diabetic nephropathy: investigation of 488 cases of diabetic glomerulosclerosis. Pathol Res Pract. 1991;187:251-259.
- [CrossRef] [PubMed] [Google Scholar]
- Leukocyte recruitment and vascular injury in diabetic nephropathy. J Am Soc Nephrol. 2006;17:368-377.
- [CrossRef] [PubMed] [Google Scholar]
- Role of inflammation in diabetic complications. Nephrol Dial Transplant. 2005;20:2601-2604.
- [CrossRef] [PubMed] [Google Scholar]
- NF-kappaB activation and over-expression of regulated genes in human diabetic nephropathy. Nephrol Dial Transplant. 2004;19:2505-2512.
- [CrossRef] [PubMed] [Google Scholar]
- Involvement of extracellular signal-regulated kinase and p38 in human diabetic nephropathy. Am J Kidney Dis. 2005;45:54-65.
- [CrossRef] [PubMed] [Google Scholar]
- Association of nuclear factor kappa B1 gene polymorphism in relation to the risk of developing nephropathy in type 2 diabetes mellitus. Proc. of 43rd Annual Conference Indian Society of Nephrology. 2012;6-9:28-29.
- [Google Scholar]
- Evaluation of nuclear factor-ķB levels in diabetic patients with and without nephropathy. Proc. of 40th Annual Conference of Association of Clinical Biochemists of India. 2013;3-6:131-132.
- [Google Scholar]
- Diabetic nephropathy. In: Brenner BM, ed. In: The Kidney. Philadelphia: WB Saunders Company; 2000. p. :1731-1773.
- [Google Scholar]
- Glomerular expression of monocyte chemoattractant protein-1 in experimental and human glomerulonephritis. Lab Invest. 1994;71:536-542.
- [Google Scholar]
- Properties of the novel pro-inflammatory super gene “intercrine” cytokine family. Annu Rev Immunol. 1991;12:503-633.
- [Google Scholar]
- Possible relationshipof monocyte chemoattractant protein-1 with diabetic nephropathy. Kidney Int. 2000;58:684-690.
- [CrossRef] [PubMed] [Google Scholar]
- Association of biomarkers of inflammation and oxidative stress with the risk of chronic kidney disease in Type 2 diabetes mellitus in North Indian population. J Diab Compl. 2013;27:548-552.
- [CrossRef] [PubMed] [Google Scholar]
- Association of tumor necrosis factor-alpha and oxidative stress in diabetic nephropathy. AACC Annual Meeting Abstracts. 2012;E-174:A-288.
- [Google Scholar]
- A comparative study of monocyte chemoattractant protein-1 and oxidative stress in diabetic nephropathy. AACC Annual Meeting Abstracts. 2012;E-174:A-288-289.
- [Google Scholar]
- A comparative study of oxidative stress parameters in diabetic and nondiabetic chronic kidney disease. Indian J Clin Biochem. 2011;26:56-57.
- [Google Scholar]
- Association of tumor necrosis factor (TNF) promoter polymorphisms with plasma TNF-α levels and susceptibility to diabetic nephropathy in North Indian population. J Diab Compl. 2015;29:338-342.
- [CrossRef] [PubMed] [Google Scholar]
- Over-expression of erythrocyte glutathione S-transferase in uremia and dialysis. Clin Chem. 1999;45:1781-1788.
- [CrossRef] [PubMed] [Google Scholar]
- A common variant in the glutathione S-transferase gene is associated with elevated markers of inflammation and lipid peroxidation in subjects with diabetes mellitus. Atherosclerosis. 2006;184:404-412.
- [CrossRef] [PubMed] [Google Scholar]
- No association of glutathione S-transferase M1 genetic polymorphism with diabetic nephropathy in Japanese Type 2 diabetes patients. Ren Fail. 2000;22:479-486.
- [CrossRef] [PubMed] [Google Scholar]
- Glutathione S-transferase T1 deletion is a risk factor for developing end-stage renal disease in diabetic patients. Int J Mol Med. 2004;14:855-859.
- [CrossRef] [Google Scholar]
- Glutathione S-Transferase M1 gene polymorphism is associated with Type 2 diabetic nephropathy. J Korean Diab Assoc. 2005;29:315-321.
- [Google Scholar]
- Association of glutathione S-transferase M1 and T1 gene polymorphism with oxidative stress in diabetic and nondiabetic chronic kidney disease. Ren Fail. 2010;32:1189-1195.
- [CrossRef] [PubMed] [Google Scholar]
- Association of GSTM1 and GSTT1 genetic polymorphism with diabetic and non-diabetic chronic kidney disease and its role in causing renal injury. Indian J Nephrol. 2009;19:S1.
- [Google Scholar]
- Effect of GSTM1 and GSTT1 double deletions in the development of oxidative stress in diabetic nephropathy patients. Indian J Biochem Biophysics. 2010;47:100-103.
- [Google Scholar]
- Role of concomitant deletion of glutathione S-transferase M1 and T1 genes in the development of oxidative stress in diabetic nephropathy. JAPI. 2009;57:838.
- [Google Scholar]
- Diabetes, oxidative stress, and antioxidants: a review. J Biochem Mol Toxicol. 2003;17:24-38.
- [CrossRef] [PubMed] [Google Scholar]
- Glutathione transferases. Annu Rev Pharmacol Toxicol. 2005;45:51-88.
- [CrossRef] [PubMed] [Google Scholar]
- Association of Glutathione-S-transferase with patients of type 2 diabetes mellitus with and without nephropathy. Diab Metabol Synd. 2016;10:194-197.
- [CrossRef] [PubMed] [Google Scholar]
- NAD (P)H:quinone acceptor oxidoreductase 1 (NQO1), a multifunctional antioxidant enzyme and exceptionally versatile cytoprotector. Arch Biochem Biophys. 2010;501:116-123.
- [CrossRef] [PubMed] [Google Scholar]
- Loss of heterozygosity at the NAD(P)H: quinone oxidoreductase locus associated with increased resistance against mitomycin C in a human bladder carcinoma cell line. Biol Chem Hoppe Seyler. 1994;375:439-445.
- [CrossRef] [PubMed] [Google Scholar]
- Genetic association of NAD (P) H Quinone Oxidoreductase (NQO1*2) polymorphism with NQO1 levels and risk of diabetic nephropathy. Biol Chem. 2016;397(8):725-730.
- [CrossRef] [PubMed] [Google Scholar]
- Polymorphisms of eNOS gene are associated with diabetic nephrology: a meta-analysis. Mutagenesis. 2011;26:339-349.
- [CrossRef] [PubMed] [Google Scholar]
- Association between endothelial nitric oxide synthase Glu298A gene polymorphism and diabetic nephropathy susceptibility. Renal Failure. 2013;35(1):173-178.
- [CrossRef] [PubMed] [Google Scholar]
- Endothelial nitric oxide synthase gene polymorphism in diabetic patients with and without nephropathy. J Am Soc Nephrol. 2016;27:429A.
- [Google Scholar]
- Higher plasma levels of advanced glycation end products are associated with incident cardiovascular disease and all-cause mortality in type 1 diabetes. Diabetes Care. 2011;34:442-447.
- [CrossRef] [PubMed] [Google Scholar]
- The role of advanced glycation end products in progression and complications of diabetes. J Clin Endocrinol Metab. 2008;93:1143-1152.
- [CrossRef] [PubMed] [Google Scholar]
- Mechanisms of disease: advanced glycation end-products and their receptor in inflammation and diabetes complications. Nat Clin Pract Endocrinol Metab. 2008;4:285-293.
- [CrossRef] [Google Scholar]
- Receptor for advanced glycation end products (RAGE) in a dash to the rescue: inflammatory signals gone awry in the primal response to stress. J Leukoc Biol. 2007;82:204-212.
- [CrossRef] [PubMed] [Google Scholar]
- Receptor for AGE (RAGE): weaving tangled webs within the inflammatory response. Curr Mol Med. 2007;7:743-751.
- [CrossRef] [PubMed] [Google Scholar]
- Association of RAGE gene polymorphism with vascular complications in Indian type 2 diabetes mellitus patients. Diab Res Clin Prac. 2014;103:474-481.
- [CrossRef] [PubMed] [Google Scholar]
- Endothelial function and oxidative stress in cardiovascular diseases. Circ J. 2009;73:411-418.
- [CrossRef] [PubMed] [Google Scholar]
- Activation of NADPH oxidase by AGE links oxidant stress to altered gene expression via RAGE. Am J Physiol Endocrinol Metabol. 2001;280:685-694.
- [CrossRef] [PubMed] [Google Scholar]
- Increased level of advanced oxidation protein products in patients with coronary artery disease. Atherosclerosis. 2002;162:221-225.
- [CrossRef] [PubMed] [Google Scholar]
- The change of oxidative stress products in diabetes mellitus and diabetic retinopathy. Br J Ophthalmol. 2008;92:548-551.
- [CrossRef] [PubMed] [Google Scholar]
- The role of advanced glycation end products (AGEs)-induced receptor (RAGE) expression in diabetic vascular complications. Microvasc Res. 2014;95:1-6.
- [CrossRef] [PubMed] [Google Scholar]
- Epigenetic histone H3 lysine 9 methylation in metabolic memory and inflammatory phenotype of vascular smooth muscle cells in diabetes. Proc Natl Acad Sci USA. 2008;105:9047-9052.
- [CrossRef] [PubMed] [Google Scholar]
- Lymphocytes from patients with type 1 diabetes display a distinct profile of chromatin histone H3 lysine 9 dimethylation: an epigenetic study in diabetes. Diabetes. 2008;57:3189-3198.
- [CrossRef] [PubMed] [Google Scholar]
- Effects of intensive glucose lowering in type 2 diabetes. N Engl J Med. 2008;358:2545-2559.
- [CrossRef] [PubMed] [Google Scholar]
- Intensive blood glucose control and vascular outcomes in patients with type 2 diabetes. N Engl J Med. 2008;358:2560-2572.
- [CrossRef] [PubMed] [Google Scholar]