Translate this page into:
Role of Adipokines in Development of Metabolic Syndrome
DR. J.S. BAJAJ ORATION delivered during the NAMSCON 2018 held at the Mahatma Gandhi Medical College & Research Institute, Puducherry.
Correspondence: Dr. Vani Gupta, Professor, Department of Physiology, King George's Medical University, Lucknow , Uttar Pradesh, India. Email: vaniphysiology@gmail.com.
Abstract
Visceral adipose tissue releases a variety of adipokines which together determine a comprehensive cardiometabolic risk profile. Estrogen deficiency leads to central fat deposition in postmenopausal women. However, premenopausal women are also running high risk of central obesity owing to unhealthy lifestyles, making them prone to development of metabolic syndrome which leads to infertility, polycystic ovary syndrome (PCOS), insulin resistance, and type 2 diabetes (T2D).
Premenopausal women with (n=30) and without (n=30) central obesity were studied. Metabolic risk factors and circulatory adipokines were measured. Insulin resistance was calculated by homeostasis model assessment (HOMA-IR). Adipokines' gene polymorphisms were studied by polymerase chain reaction and mRNA expression of leptin, adiponectin, resistin, and interleukin-6 (IL-6). Tumour necrosis factor-α (TNF-α), acylation stimulating protein (ASP) receptor gene (C5L2) were done by real time-polymerase chain reaction in visceral (VAT) and subcutaneous (SAT) adipose tissues was also obtained.
Significant high circulating leptin, IL-6, TNF-α, resistin and their VAT mRNA expression and significant low circulating adiponectin and VAT mRNA expression were found in women with metabolic syndrome, irrespective of their menopausal status. Carriers of mutant genotype of TNF-α 308 AA, IL-6 174 CC, resistin 420 GG, leptin 2549 AA, adiponectin 276 TT and C5L2 698 CT had significant association with metabolic syndrome. Conclusively changes in fat distribution modulate the secretion profile of adipokines, therefore elevated circulating leptin, IL-6, TNF-α, ASP, resistin, and low adiponectin may serve as surrogate markers for metabolic syndrome and related morbidities in women with central obesity.
Keywords
Central obesity
visceral adipose tissue
subcutaneous adipose tissue
mRNA
adipokines
insulin resistance
metabolic syndrome.

Introduction
Postmenopausal women are more prone for central obesity attributed to hormonal changes occurring during menopausal transition and in postmenopausal period; but recent studies have shown that adult premenopausal women also carry equal risk of central obesity and are prone for development of metabolic syndrome which leads to infertility, polycystic ovary syndrome (PCOS), adiposity, insulin resistance, diabetes and endocrinological problems. Females generally have a characteristic gynecoid type of fat distribution, with adipose tissue prominently developing in the subcutaneous depots around the hips and thighs. Female hormones make it easier to convert fat into food. Estrogen deficiency is responsible for centralization of fat deposition, i.e. visceral fat deposition or abdominal fat deposition, which is characterised as increased adipose tissue surrounding the intra-abdominal organs; this fat enhances metabolic dysfunction predisposing to type 2 diabetes mellitus (T2DM), the metabolic syndrome, and cardiovascular diseases. Visceral adipose tissue (VAT) also determines a comprehensive cardiovascular risk profile and increases the susceptibility to ischemic heart disease and arterial hypertension (1-3). VAT releases different bioactive molecules and hormones, such as adiponectin, leptin, tumour necrosis factor, resistin and interleukin-6 (IL-6), and acylation stimulating protein (ASP). Among these hormones, adiponectin and leptin are of particular significance owing to their involvement in the regulation of energy homeostasis, neuroendocrine function, haematopoiesis, angiogenesis, and reproduction (4). Circulating adiponectin is inversely correlated with the amount of VAT (5) while decreased concentrations of adiponectin are associated with T2D, elevated glucose levels, hypertension, cardiovascular disease and certain malignancies (5, 6). Leptin, released primarily from adipocytes and its expression, is directly related to the lipid content of the cells (7), its greater expression being found in the subcutaneous tissue (SAT) compared to VAT (8). Leptin increases with obesity (9) and its circulating levels are closely associated with all indices of adiposity. Consequently, it may be important to measure VAT mRNA expression of adiponectin and leptin along with their circulating level to better understand the pathogenesis of central obesity (VAT) related disorders in premenopausal women. Visceral obesity is associated with poor prognosis, metabolic disturbances, and degree of pathology in several chronic diseases.
Methods
This is a cross-sectional case control study. A total of 60 women (30 women with central obesity and 30 women without central obesity) age matched (22-39 years) were recruited at K.G. Medical University Lucknow, India who underwent elective abdominal surgery for gall bladder stone, hysterectomy or bariatric surgery. VAT was obtained during the surgery. During surgery neither specific standard diet nor any hormonal therapy were given to the patient, which ensured and ruled out the effect of hormone or diet on fat deposition. All tissue samples were stored in RNA later (Sigma –Aldrich) for the stability of RNA. This study is approved by Institutional Ethics Committee. Subjects were classified as premenopausal women with central obesity having waist hip ratio (WHR) > 0 .85 as per WHO guidelines for Asians. Premenopausal women without central obesity having WHR< 0.85 served as controls. WHR is a good marker for central / visceral obesity (waist circumference was measured at the narrowest point superior to the hip and divided by the circumference of the hip measured at its greatest gluteal protuberance). Height (Ht.), weight (Wt.), waist circumference (WC) and hip circumference (HC) were measured. Body mass index (BMI) was calculated as weight (in kilograms) divided by height (in meter) square. Informed consent was obtained from each participant.
Laboratory Measurements
Fasting blood samples for biochemical parameters were obtained in the morning after their admission to the hospital for surgery. Plasma glucose concentration was determined by glucose-peroxidase metahod (Merck) using semi automated glucose analyser (Microlab 300, Merck). Leptin (Diagnostics Biochem Canada Inc., Cat. No. CAN-L-4260, Version 6.0, London, Ontario, Canada) and adiponectin (Human Adiponectin Cat. No. DRP300, R&D System Inc., Oxford, UK) were measured by enzyme linked immunosorbent assay. Plasma insulin concentration was determined using immuno radiometric assay (IRMA) (Immunotech). Insulin resistance was calculated by homeostatic model assessment index (HOMA Index) (10) using following formula:
HOMA-IR = [fasting insulin (μ,U/ mL) x fasting glucose (mM)/22.5] If HOMA-IR ≥ 3.16 Insulin resistance If HOMA-IR ≤ 3.16 Non Insulin resistance
RNA Extraction
Total RNA was isolated from adipose tissue (30 mg of visceral fat / omental fat) with the RNA easy mini kit (Qiagen, USA) according to the manufacturer protocol. RNA was measured by spectrophotometric method at 260 and 280 nm while RNA integrity was checked by visual inspection of the two ribosomal RNAs 18s and 28s on agrose gel.
Measurement of Leptin and Adiponectin by Real-time PCR
One-steps real-time reverse transcriptase (RT)-PCR is a sensitive method for quantification of specific mRNAs. In this approach, the RT as well as the PCR reaction was run together on the light cycler platform using quanti tect SYBR green RT-PCR kit (Qiagen, Hilden, Germany, CAT No.204243). SYBR green is a dye that binds to double but not single stranded DNA is used in quantitative PCR reactions. The reagents used were contained within the Light Cycler 2x Quantitect SYBR Green RT- PCR master mix which includes Hot Star Taq DNA polymerase, Quantitect SYBR Green RT-PCR Buffer, NTP mix, SYBR Green I, 5 mM MgCl and quantitect RT mix which include omniscript reverse transcriptase and sensiscript reverse transcriptase.
All real-time reactions were performed in a Roche light cycler according to the manufacturer's instructions. Total 30 ng RNA was used for PCR to analyze the gene expression of adiponectin, leptin and β-actin. The primer for PCR amplification of adiponectin F 5 ' GT GAT G G CAGA GAT G GCAC3' R5'GCCTTGTCCTTCTTGAAGAG3' leptin F5'GCTGTGCCCATCCAAAAAGT3, R 5'ACTGCCAGTGTCTGGTCCAT3 and β-actin F-5' GTGGCATCCACGAAACTA CCTT 3' R 5' GGACTCCTGATACTCCTGCT TG3' synthesized by (Agile Life Science Technolo gy India). The annealing temperatures of gene is (Reverse transcription) 50°C for 30 min, (initial denaturation) 95°C for 15 min followed by 40 cycles of 94°C, 15 sec, (adiponectin is 52°C and for leptin and β-actin is 59°C), 30 sec and 72°C, 30 sec for denaturation, annealing, extension steps respectively done by light cycler 480 (Roche, real-time thermal cycler) the prepared reaction components were done in 96 well PCR plate. The reaction was set according to the standard protocol recommended by Qiagen. PCR reactions were carried out in total volume of 25 μl. Expression of p-actin was used to normalized adiponectin and leptin expression values. There was no difference in glyceraldehy de -3- phosphatedehydrogenase or β-actin expression between women with central obesity or without central obesity.
Statistical Analysis
Data were expressed as mean ± SD. Anthropometric measurement, biochemical parameter and VAT adiponectin and leptin mRNA expression of two independent groups were compared by Student t test. Correlation was done to access association of VAT leptin and adiponectin mRNA expression with WHR and HOMA-IR, considering WHR and HOMA-IR an independent variable and VAT mRNA expression of leptin and adiponectin, the dependent variable. A two sided (α=2) p<0.05 was considered statistically significant.
Result
Table 1 shows hormonal profile of premenopausal women with central obesity and without central obesity. Serum FSH, LH, free testosterone, estradiol, DHEA and TSH were significantly high (p<0.05) in premenopausal women with central obesity than without central obesity while serum estradiol was significantly low in women with central obesity. The basic characters, viz. physical (age, weight, height, waist circumference, hip circumference, BMI, waist to hip ratio) and biochemical parameters (glucose, insulin, HOMA-IR) are shown in Table 2; weight, WC, BMI, WHR, insulin, glucose, HOMA-IR were significantly (p < 0.05) higher in premenopausal women with central obesity than without central obesity. The VAT adiponectin and leptin mRNA expression of premenopausal women with central obesity and women without central obesity shown in Table 3 and Fig. 1(a, b), VAT leptin mRNA expression Fig. 1 (a) was high in premenopausal women with central obesity than without central obesity (0.66 ± 0.19 vs. 0.28 ± 0.12). VAT adiponectin mRNA expression [Fig. 1(b)] was significantly low in premenopausal women with central obesity (0.57 ± 0.16 vs. 0.87 ± 0.21). Mean circulating level of leptin [Fig. 2(a)] was also high (31.6 ±14.21 vs. 22.53 ± 11.04) and adiponectin level [Fig. 2(b)] was low (7.6 ± 2.4 vs. 11.72 ± 3.53) in premenopausal women with central obesity than without central obesity.
| Hormone Level | Premenopausal Women WHR <0.85 (n= 30) |
Premenopausal women WHR >0.85 (n=30) |
p-value |
|---|---|---|---|
| FSH (mlU/ml) | 6.30±2.90 | 22.10±6.50 | <0.001* |
| LH (IU/ml) | 5.60±1.35 | 18.65± 4.25 | <0.001* |
| F-Testosterone (ng/dl) | 57.35±18.70 | 72.28±11.85 | 0.004* |
| Estradiol (pg/ml) | 111.25±94.12 | 35.05±15.82 | <0.001* |
| TSH (μIU/ml) | 1.42±0.78 | 1.78±0.80 | <0.001* |
| SHBG (nmol/l) | 44.15±14.55 | 46.02±21.80 | 0.548 |
| DHEA (μg/dl) | 111.45±18.45 | 167.30±25.20 | <0.001* |
Data are as mean ± SD *P < 0.05 = significant
| Variables | Premenopausal Women with central obesity n = 30 |
Premenopausal Women without central obesity n=30 |
P-Value |
|---|---|---|---|
| Age (yr) | 28±4.10 | 26±5.80 | 0.12 |
| Weight (kg) | 62.68±12.45 | 52±9.50 | <0.0001* |
| Height (cm) | 151.57±7.07 | 153±6.76 | 0.10 |
| BMI (kg/m2) | 27.33±5.57 | 22.21±3.72 | <0.0001* |
| WC (cm) | 83.14±14.71 | 70±8.91 | <0.0001* |
| WHR | 94.96±11.18 | 85±7.89 | <0.0001* |
| HC (cm) | 0.87±0.06 | 0.82±0.04 | 0.0002* |
| Glucose (mg/dl) | 125.62±21.66 | 93±10.15 | <0.0001* |
| Insulin (μU/ml) | 11.67±5.77 | 9.36±4.00 | 0.008* |
| HOMA-IR | 3.73±2.15 | 2.18±1.04 | 0.0003* |
| Leptin (pg/ml) | 31.6 ± 14.21 | 22.53 ±11.04 | <0.0001* |
| Adiponectin (pg/ml) | 7.6 ± 2.4 | 11.72 ± 3.53 | <0.002* |
Data are as mean ± SD *P < 0.05 = significant ; BMI: Body mass index; W C: Waist circumference; H C: Hip circumference ; WHR : Waist Hip Ratio; HOMA - IR: homeostatic model assessment for insulin resistance.
| Adipokines | Visceral adipose tissue (VAT) | P-value | |
|---|---|---|---|
| Premenopausal women with central obesity (n= 30) |
Premenopausal women without central obesity (n= 30) |
||
| Leptin | 0.66 ± 0.19 | 0.28 ± 0.12 | 0.001* |
| Adiponectin | 0.57 ± 0.16 | 0.87 ± 0.21 | <0.001* |
Data are as mean ± SD *P < 0.05 = significant
The correlations of VAT leptin and adiponectin mRNA expression of premenopausal women having central obesity with their WHR and insulin resistance (HOMA- IR) are shown in Table 4. The VAT leptin mRNA expression was positively correlated with WHR (R=0.61, p < 0.001) and insulin resistance, i.e. HOMA-IR (R=0.72, p < 0.001). However, VAT adiponectin mRNA expression was negatively correlated with WHR (R=-0.76, p <0.001) and insulin resistance HOMA-IR, i.e. (R=-0.59, p < 0.002). Premenopausal women without central obesity have positive correlation of VAT leptin mRNA with WHR (R=0.24, p=0.13) and HOMA-IR (R=.06, p=0.71) but not significant. Adiponectin VAT mRNA level have negative correlation with WHR (R=-0.15, p= 0.23) and HOMA-IR (R=-0.09, p=0.43) but not significant in premenopausal women without central obesity.
| Variables | Leptin VAT m-RNA (r-value) | P-value | Adiponectin VAT m -RNA (r-value) | P-value |
|---|---|---|---|---|
| WHR | 0.61 | <0.001* | -0.78 | <0.0001* |
| HOMA-IR | 0.72 | <0.0001* | -0.59 | <0.002* |
*P < 0.05 = significant; WHR: Waist hip ratio; HOMA-IR: Home ostatic model assessment for insulin resistance.
Discussion
This study was undertaken to evaluate mRNA expression of adiponectin and leptin of VAT and their circulatory levels in premenopausal women with central obesity and without central obesity. Correlation of mRNA expression and circulatory level of both adipokines with WHR and insulin resistance, i.e. HOMA-IR were also observed. Observations of the present study show that premenopausal women with central obesity have significantly higher serum level of FSH, LH, free testosterone, TSH and DHEA while significantly low estradiol as compared to women without central obesity. These observations suggest hyperandrogenemia and low circulating estrogen in premenopausal women with central obesity responsible for centralization of fat. They also had significant high WC, WHR and BMI than women without central obesity. These observations were in concordance with other studies (11, 12) which have concluded that WC yields a better correlation values with all the metabolic risk factors indicating that WHR may be a better index for abdominal obesity / central obesity due to high visceral adipose tissue than BMI in Asian Indians. The observation shows that significant higher plasma glucose and plasma insulin and HOMA- IR were found in women with central obesity suggesting the presence of insulin resistance. Insulin hormone regulates virtually all aspects of adipocytes functioning. Insulin increases the uptake of fatty acids by stimulating lipoprotein lipase activity in adipose tissue. There is increasing evidence supporting the fact that by the time glucose intolerance or fasting hyperglycemia set in appreciable β-cell destruction may have already occurred (13).
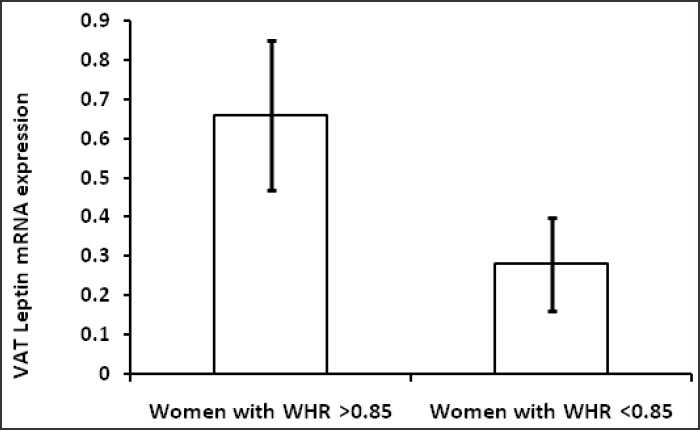
- (a) VAT Leptin mRNA expression in women with central obesity and without central obesity.
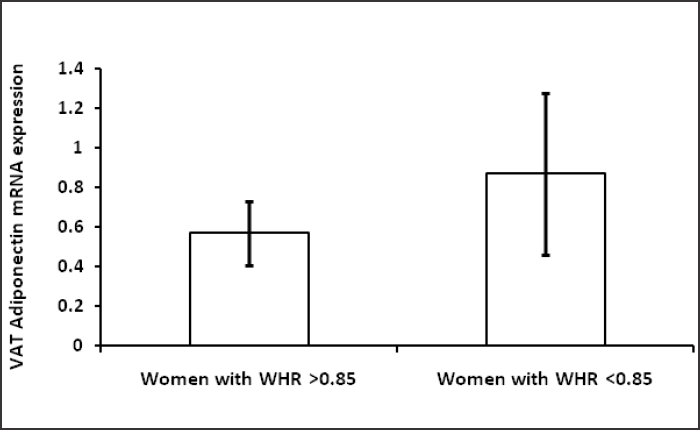
- (b) VAT Adiponectin mRNA expression in women with central obesity and women without central obesity.
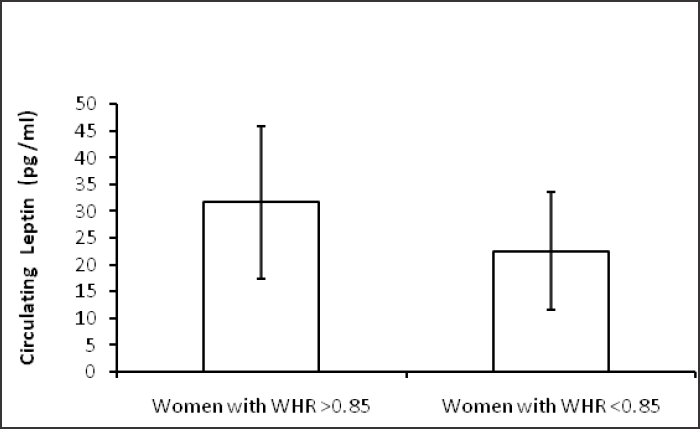
- (a) Circulating leptin (pg/ml) level in women with central obesity and women without central obesity.
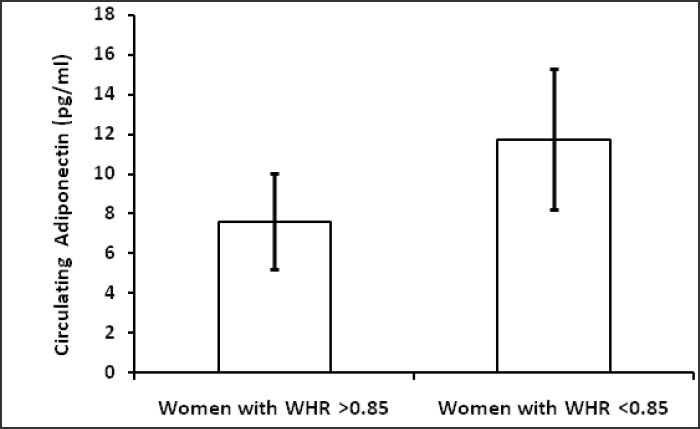
- (b) Circulating adiponectin (pg /ml) level in women with central obesity and women without central obesity.
In the present study, circulating level and VAT mRNA expression of adiponectin level was found to be significantly lower in women with central obesity as compared to women without central obesity and low adiponectin VAT mRNA level in women with central obesity is strongly associated with HOMA-IR and WHR. Our results are in concordance with other studies showed lower concentration of adiponectin is associated with WHR (14) and insulin resistance (15) , as well as lower adiponectin mRNA expression in the VAT of type 2 diabetic patients (16) . Further, the findings of the present study are also consistent with other study which showed significantly lower adiponectin gene expression and protein content in VAT of obese as compared to non-obese (17). Low adiponectin levels are more strongly associated with the amount of visceral fat than subcutaneous fat (18). Adiponectin have profound protective role in obesity. Several studies suggest that the decreased concentration of adiponectin in obesity, leads to the development of metabolic syndrome (19). In vivo and in vitro studies have demonstrated that adiponectin enhances insulin sensitivity, increases fatty acid oxidation, glucose uptake, suppresses hepatic glucose production (20) and has protective antiangiogenic effect.
These studies strongly indicate that adiponectin acts on multiple tissues to enhance insulin sensitivity thus, referred to as an insulin sensitizer. A recent study showed that adiponectin enhances insulin-stimulated IRS-1 tyrosine phosphorylation and Akt phosphorylation (21). This study further revealed that activation of the serine / threonine kinase 11/AMP-activated protein kinase (AMPK) / TSC1/2 pathway alleviates the p70S6 kinase-mediated negative regulation of insulin signalling, providing a mechanism by which adiponectin increases insulin sensitivity in cells.
Leptin produced by adipose tissue acts as a satiety hormone, is a major regulator of body weight and food intake and deficiency in leptin leads to obesity. However, in the present study circulatory leptin and its VAT mRNA expression level was found to be significantly higher in women with central obesity which may be due to leptin resistance, showing negative association with adiponectin also (22). Like adiponectin, leptin also modulates several metabolic processes including glucose regulation and fatty acid breakdown. We observed significantly higher VAT leptin mRNA expression and its association with WHR in women with central obesity. Other studies showed that high leptin mRNA level was found in subcutaneous fat compared to VAT (23).
Our study also shows that high circulating leptin is significantly associated with HOMA- IR. This indicates that leptin resistance runs hand in hand with insulin resistance (12). In mice that became obese after being fed a high-fat diet, leptin concentration was increased, and this increase was accompanied by an increased expression of SOCS-3 (suppressor-of-cytokine- signaling), a potent inhibitor of leptin signaling (24).
The mRNA expression of leptin in adipose tissue is strongly associated with fat mass in obesity. Thus, leptin appears as a real marker of adipose tissue mass in humans where the subcutaneous fraction represents about 80% of total fat (25). Although, the principal biological effect of leptin in the central nervous system is control of food intake and energy expenditure. There is a significant relationship between leptinaemia and the chronic sub-inflammatory state in obesity.
Leptin pathways act in concert with insulin to control glucose and lipids, aside from regulating food intake and metabolic rate, linking this hormone to IR and T2D. Leptin can act through some of the components of the insulin signalling cascade, such as insulin receptor substrate (IRS)-1 and IRS-2, mitogen- activated protein kinase (MAPK) and phosphatidylinositol 3-kinase (PI3-kinase), suggesting that there are cross-talk between insulin and leptin signalling pathways (26). However, some schools of thought suggests that association of leptin with insulin resistance in T2D and obesity may be through its regulation of the deposition of fat in insulin responsive tissues, rather than through effects on insulin signalling. The role of high leptin in obesity associated IR is still controversial (27).
Conclusion
Changes in fat distribution lead to a modification of the secretion profile of adipokines especially leptin and adiponectin, the two adipokines play important role in energy homeostasis of adipose tissue. High circulatory level and VAT mRNA expression of leptin and its positive correlation with HOMA-IR suggest that central obesity is a leptin-resistant state might be induced by insulin resistance. Low circulating level and mRNA expression of adiponectin and its negative correlation with HOMA-IR suggest its protective role. So circulatory leptin and adiponectin may serve as surrogate markers for development of insulin resistance and related morbidities in premenopausal women with central obesity.
Acknowledgement
We would like to acknowledge faculty, residents of Surgery and Obstetrics & Gynaecology Deptt. of King George's Medical University, Lucknow and participants of this study for providing sample. This study was funded by Indian Council Medical Research (ICMR) No. 5/7/270/08-RHN, New Delhi, India. There is no conflict of interest and no financial disclosure.
References
- Abdominal visceral and subcutaneous adipose tissue compartments: association with metabolic risk factors in the Framingham Heart Study. Circulation. 2007;116:39-48.
- [CrossRef] [PubMed] [Google Scholar]
- Visceral obesity and the risk of ischaemic heart disease: insights from the Quebec Cardiovascular Study. Growth Horm IGF Res. 1998;8:1-8.
- [CrossRef] [PubMed] [Google Scholar]
- Measures of abdominal obesity assessed for visceral adiposity and relation to coronary risk. Intl J Obes Relat Metab Disord. 2004;8:1018-1025.
- [CrossRef] [PubMed] [Google Scholar]
- From leptin to other adipokines in health and disease: facts and expectations at the beginning of the 21st century. Metabolism. 2015;64:131-145.
- [CrossRef] [PubMed] [Google Scholar]
- Lower plasma adiponectin levels are associated with larger tumor size and metastasis in clear-cell carcinoma of the kidney. Eur Urol. 2008;54:866-873.
- [CrossRef] [PubMed] [Google Scholar]
- The link between abdominal obesity, metabolic syndrome and cardiovascular disease. Nutr Metab Cardiovasc Dis. 2007;17:319-326.
- [CrossRef] [PubMed] [Google Scholar]
- Determinants of leptin gene expression in fat depots of lean mice. Am J Physiol Regul Integr Comp Physiol. 2002;282:R226-R234.
- [CrossRef] [PubMed] [Google Scholar]
- Leptin secretion from subcutaneous and visceral adipose tissue in women. Diabetes. 1998;6:913-917.
- [CrossRef] [PubMed] [Google Scholar]
- Relationship of Leptin with adiposity and inflammation and resistin with disease severity in psoriatic patients undergoing anti-TNF-alpha therapy. J Eur Acad Dermatol Venereol. 2015;29:1995-2001.
- [CrossRef] [PubMed] [Google Scholar]
- Homeostasis model assessment is more reliable than the fasting glucose/insulin ratio and quantitative insulin sensitivity check index for assessing insulin resistance among obese children and adolescents. Pediatrics. 2005;4:500-503.
- [CrossRef] [PubMed] [Google Scholar]
- An evaluation of candidate definitions of the metabolic syndrome in adult Asian Indians. Diabetes Care. 2005;28:398-403.
- [CrossRef] [PubMed] [Google Scholar]
- Interleukin-6 G-174C gene polymorphism and serum resistin levels in North Indian women: potential risk of metabolic syndrome. Hum Exp Toxicol. 2011;30:1445-1453.
- [CrossRef] [PubMed] [Google Scholar]
- Insulin resistance is central to the burden of diabetes. Diab Metab Res Rev. 1997;13:81-86.
- [CrossRef] [Google Scholar]
- Relationship of plasma adiponectin and waist-hip ratio with coronary artery disease. Med Arch. 2016;6:413-418.
- [CrossRef] [PubMed] [Google Scholar]
- Adipocytokines in systemic lupus erythematosus: relationship to inflammation, insulin resistance and coronary atherosclerosis. Lupus. 2009;9:799-806.
- [CrossRef] [PubMed] [Google Scholar]
- Decreased expression of apM1 in omental and subcutaneous adipose tissue of humans with type 2 diabetes. Intl J Exp Diabetes Res. 2000;1:81-88.
- [CrossRef] [PubMed] [Google Scholar]
- The impact of obesity on secretion of adiponectin multimeric isoforms differs in visceral and subcutaneous adipose tissue. Intl J Obes. 2012;36:1360-1365.
- [CrossRef] [PubMed] [Google Scholar]
- Relationships between circulating adiponectin levels and fat distribution in obese subjects. J Atheroscler Thromb. 2011;18:592-595.
- [CrossRef] [PubMed] [Google Scholar]
- Adipokines and genetic factors in overweight or obese but metabolically healthy Polish women. Neuro Endocrinol Lett. 2010;4:497-506.
- [Google Scholar]
- Involvement of AMP-activated protein kinase in glucose uptake stimulated by the globular domain of adiponectin in primary rat adipocytes. Diabetes. 2003;52:1355-1363.
- [CrossRef] [PubMed] [Google Scholar]
- Adiponectin and metabolic syndrome in middle aged and elderly Chinese. Obesity. 2008;1:172-178.
- [CrossRef] [PubMed] [Google Scholar]
- Plasma orexin A, orexin B, leptin, neuropeptide Y (NPY) and insulin in obese women. Neuro Endocrinol Lett. 2005;4:293-296.
- [Google Scholar]
- Difference in leptin mRNA levels between omental and subcutaneous abdominal adipose tissue from obese humans. Horm Metab Res. 1996;28(12):690-693.
- [CrossRef] [PubMed] [Google Scholar]
- Molecular and anatomical determinants of central leptin resistance. Nat Neurosci. 2005;8:566-570.
- [CrossRef] [PubMed] [Google Scholar]
- The expression of ob gene is not acutely regulated by insulin and fasting in human abdominal subcutaneous adipose tissue. J Clin Invest. 1996;98:251-255.
- [CrossRef] [PubMed] [Google Scholar]
- Selective interaction between leptin and insulin signaling pathways in a hepatic cell line. Proc Natl Acad Sci. 2000;97:2355-2360.
- [CrossRef] [PubMed] [Google Scholar]
- Leptin down-regulates insulin action through phosphorylation of serine- 318 in insulin receptor substrate 1. FASEB J. 2006;20:1206-1208.
- [CrossRef] [PubMed] [Google Scholar]