Translate this page into:
Time Trends in Prevalence of Anemia in Preschool Children in India
Address for correspondence Prema Ramachandran, DGO, MD, Nutrition Foundation of India, C13 Qutub Institutional Area, New Delhi 110016, India (e-mail: f1prema@gmail.com).
This article was originally published by Thieme Medical and Scientific Publishers Pvt. Ltd. and was migrated to Scientific Scholar after the change of Publisher.
Abstract
Introduction
Anemia is a major public health problem in Indian children. India introduced iron-folic acid supplementation for preschool children in the 1970s. In 1990, the component of detection and treatment of anemia was added. It is important to assess the impact of these programs on the prevalence of anemia in preschool children.
Materials and Methods
Prevalence of anemia in preschool children at the national and state level was tabulated from National Family Health Survey (NFHS) 2, 3, and 4 national and state reports. Raw data from NFHS 2, 3, 4; District Level Household Survey (DLHS) 2 and 4; and Annual Health Survey and its Clinical Anthropometric and Biochemical component (AHS CAB) were analyzed to find out the changes in mean Hb, prevalence of anemia, and frequency distribution of Hb.
Results
Compared with NFHS 2, there was a 5% increase in prevalence of anemia, 0.3 g/dL fall in mean Hb levels, and a small shift to the left in frequency distribution of Hb levels in NFHS 3. There was a 10% reduction in prevalence of anemia in NFHS 4 as compared with NFHS 3. Comparison between DLHS 2, DLHS 4, and AHS CAB showed that there was a 15 to 20% reduction in prevalence of anemia, approximately 1 g/dL increase in mean Hb and a shift to the right in distribution of Hb levels.
Conclusion
There has been some improvement in Hb levels in preschool children in the last decade, but prevalence of anemia continues to be very high. Effective implementation of the comprehensive package of interventions recommended in National Iron Plus Initiative (NIPI) guidelines is urgently needed to achieve rapid and sustained reduction in anemia.
Keywords
dietary intake of iron
dietary intake
iron fortified iodized salt
test and treat strategy

Introduction
India has recognized the prevalence of anemia among preschool children as a major public health problem. Research studies in India had documented that poor iron stores in infants born to anemic mothers, poor dietary intake of iron and folate, and poor bioavailability of iron from Indian dietaries were the major factors responsible for high prevalence of anemia; infections like malaria in endemic areas aggravated the preexisting anemia. Intervention programs to address major factors responsible for anemia were initiated in the 1970s of the last century. Applied nutrition program focused on homestead vegetable cultivation for increasing consumption of vegetables for improving iron and folate intake. Health sector interventions aimed at early detection and effective treatment of malaria and hook worm infection to reduce anemia in preschool children. However, the coverage under these interventions programs was very low as rural and urban nutrition and primary health care institutions had not been developed. Given the infrastructural constraints, screening all children and detection and treatment of anemic children was not possible. Therefore, the country embarked on identifying preschool children and providing all of them with iron and folic acid (IFA) supplementation. Available limited data from 1970 to 1999 based on surveys conducted by the National Nutrition Monitoring Bureau and small scale research studies showed that the coverage under IFA supplementation in preschool children was low due to erratic availability and poor distribution of iron folic acid syrup as well as pediatric iron folic acid tablets; compliance with supplementation was poor because when children had initial minor gastro-intestinal side effects, the health system could not provide needed supportive supervision and reassurance.
By 1990s, most of the primary health care institutions in urban and rural areas were functional and it was expected that the coverage under IFA supplementation in pre-school children will improve. To monitor progress, coverage, and impact of IFA supplementation were incorporated as a part of all the national health and nutrition surveys. Data on these two aspects are now available from National Family Health Survey (NFHS 2 [1998–99]),1 and NFHS 3 [2005–2006]),2 and 4 (2015),3 National Nutrition Monitoring Bureau (NNMB) micro-nutrient survey (2003),4 District Level Household Survey (DLHS 2 [2002–04],5 and DLHS 4 [2013–14]),6 and Clinical Anthropometric and Biochemical (CAB) component of the Annual Health Survey (AHS; 2014–15).7 All these surveys showed that the coverage under iron-folic acid (IFA) supplementation in preschool children continues to be very low (< 10%) in many states. Erratic availability and distribution of iron folic acid syrup as well as pediatric iron-folic acid tablets continue to be the major factors responsible for low coverage.
Over the last four decades there has been:
Some improvement in socio-economic status, household food security, and dietary intakes.
Steady if slow reduction in under-nutrition rates in preschool children.
Improvement in access to health care and reduction in malaria and hook worm infestation.
It is important to find out whether there has been any improvement in Hb levels and reduction in prevalence of anemia in preschool children in the last two decades, so that appropriate modifications can be made in the ongoing intervention programs for combating anemia.
Materials and Methods
Data on prevalence of anemia in the period between 1998 and 2016 at national and state level are available from NFHS 2, 3, and 4 national and state reports, DLHS-2 report, and DLHS-4 and AHS CAB fact sheets. NFHS surveys used Hemocue method for estimation of Hb; NNMB, DLHS, and AHS CAB used cyanmethaemoglobin method for Hb estimation. There have been several publications indicating that there were differences in Hb levels estimated by cyanmethaemoglobin method and Hemocue method.8-11 Therefore, the trends on changes in Hb were calculated separately for the NFHS series and AHS/DLHS series.
Data on prevalence of anemia in preschool children in India and different states were tabulated from the reports of the NFHS 2, 3, and 4. Raw data from NFHS 2, 3, and 4 were obtained from Demographic and Health Survey Program ICF International. The mean Hb levels in under-three in NFHS 2, under-three and under-five children in NFHS 3, and under-five in NFHS 4 were computed and compared. Frequency distribution of Hb in under-three children in NFHS 2 and 3 and under-five children in NFHS 3 and 4 were computed and compared.
DLHS 2 covered all the states and UTs; AHS CAB covered 9 poorly performing states (AHS CAB states), while DLHS4 covered 21 states and UTs (DLHS 4 states). The raw data of DLHS 2, 4, and AHS CAB were analyzed. Prevalence of anemia and the mean Hb levels in preschool children in DLHS 2 and 4 and AHS CAB were computed. The mean and frequency distribution of Hb and prevalence of anemia in preschool children in DLHS 2 were compared with the mean and frequency distribution of Hb and prevalence of anemia in preschool children in DLHS 4 and AHS CAB in the respective states.
Results
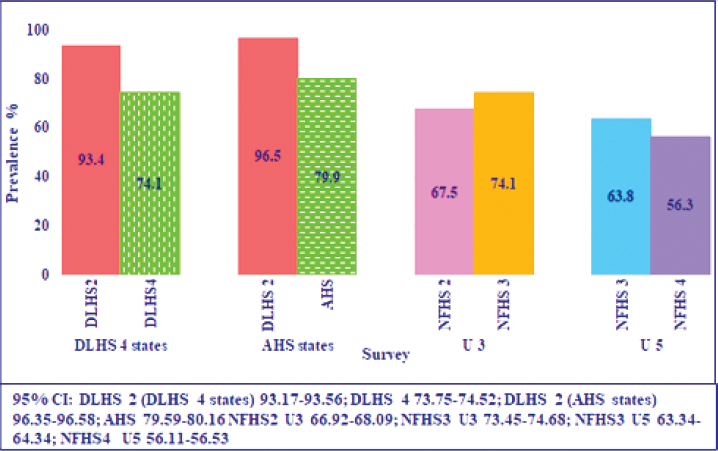
The age group and number of preschool children surveyed, blood sample collected, and valid Hb results available in different surveys are shown in ►Table 1. Prevalence of anemia at national level in preschool children was high in NFHS 2, 3, and 4 (►Fig. 1).
- Time trends in prevalence of anemia (DLHS 2, 4 AHS, and NFHS 2, 3, 4).
| Survey | Age of children surveyed (months) | Total number of children | Blood sample taken | Valid Hb |
|---|---|---|---|---|
| DLHS 2 | 6–71 | 313,646 | 195,193 | 173,684 |
| NFHS 2 | 6–35 | 28,662 | 27,268 | 27,261 |
| NFHS 3 | 6–59 | 48,084 | 35,851 | 35,844 |
| NFHS 4 | 6–59 | 259,627 | 209,496 | 209,295 |
| DLHS 4 | 6–59 | 71,707 | 48,896 | 44,494 |
| AHS CAB | 6–59 | 148,307 | 75,324 | 73,278 |
Abbreviations: AHS CAB, Annual Health Survey Clinical Anthropometric and Biochemical component; DLHS, District Level Household Survey; NFHS, National Family Health Survey.
There was a 5% increase in prevalence of anemia in the 6 to 35 months age group in NFHS 3 as compared with NFHS 2. There was a 10% reduction in the prevalence of anemia in under-five children in NFHS 4 as compared with NFHS 3. There were substantial inter-state differences in the prevalence of anemia in all the three surveys. Prevalence of anemia in the Southern and Western states was lower as compared with the Central and Northern states both in under-three and under-five and across all the three surveys. Prevalence of anemia in under-three children was higher in NFHS 3 as compared to NFHS 2 in most but not all states. Prevalence of anemia in under-five children was lower in NFHS 4 as compared with NFHS 3 in all states though the magnitude of reduction varied between states.
Mean Hb levels (►Fig. 2) in:
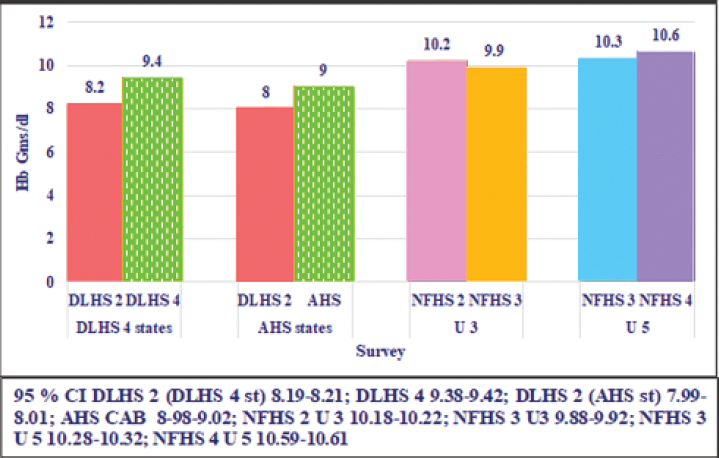
- Time trends in mean Hb (DLHS 2, 4 AHS CAB NFHS 2, 3, and NFHS 4).
Under-three children were lower in NFHS 3 as compared with NFHS 2.
-
Under-five children in NFHS 3 was lower as compared with NFHS4.
○ Frequency distribution of Hb:
In under-three children in NFHS 3 was to the left of Hb in under-three in NFHS 2 (►Fig. 3).
In under-five-children in NFHS 3 was to the left of the under-five children in NFHS 4 (►Fig. 3).
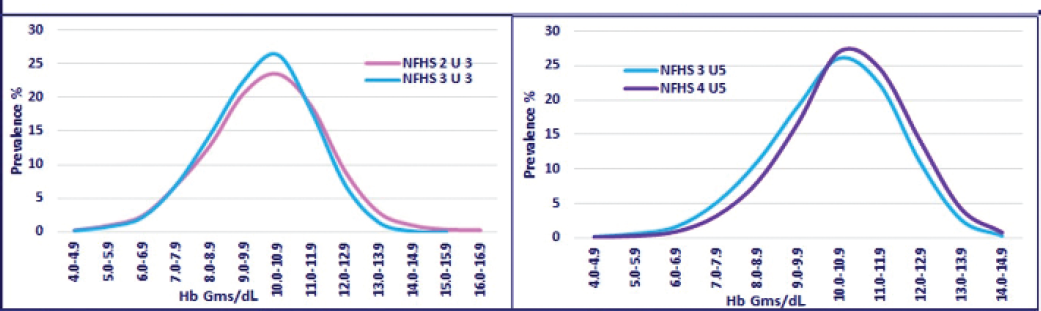
- Time trends in frequency distribution of Hb in under-three (NFHS 2, 3) and in under-five children (NFHS 3, 4). NFHS, National Family Health Survey; Hb, hemoglobin.
Prevalence of anemia in under-five children in DLHS 4 states in DLHS 2 and 4, and prevalence of anemia in AHS CAB states in DLHS 2 and AHS CAB is shown in ►Fig. 1 Prevalence of anemia in under-five children in AHS CAB states were higher as compared with the DLHS 4 states. There was a 20% reduction in the prevalence of anemia in DLHS 4 states and a 15% reduction in AHS CAB states as compared with the DLHS 2.
Mean Hb in DLHS 4 and AHS CAB states is shown in ►Fig. 2. The mean Hb levels in DLHS 4 states were higher as compared with AHS CAB states in both time periods. As compared with Hb levels in DLHS 2, there was an improvement in mean Hb of approximately 1.3 g/dL in the DLHS 4 states and 1 g/dL AHS CAB states.
Inter-state differences in prevalence of anemia in under-five children in AHS CAB and DLHS 4 states are shown in ►Fig. 4. There were substantial inter-state differences in the prevalence of anemia in all the three surveys. Prevalence of anemia was lower in DLHS 4 states as compared with AHS CAB states at both the time points (►Fig. 4). In all states except Uttarakhand, prevalence of anemia was lower in DLHS 4 and AHS CAB.

- Inter-state variation in prevalence of anemia (DLHS 2, 4 and AHS CAB). OR, Orissa; BH, Bihar; JH, Jharkhand; UP, Utter Pradesh; RJ, Rajasthan; CH, Chhattisgarh; MP, Madhya Pradesh; UK, Uttarakhand; MH, Maharashtra; KA, Karnataka; WB, West Bengal; PB, Punjab; HP, Himachal Pradesh; AP + TG, Andhra Pradesh + Telangana; HR, Haryana; TN, Tamil Nadu; KL, Kerala.
Frequency distribution of Hb in under-five children in DLHS 2 was compared with Hb distribution in DLHS 4 states and AHS states, respectively. There was a clear shift to the right in the frequency distribution of Hb both in DLHS 4 states and AHS states (►Fig. 5).
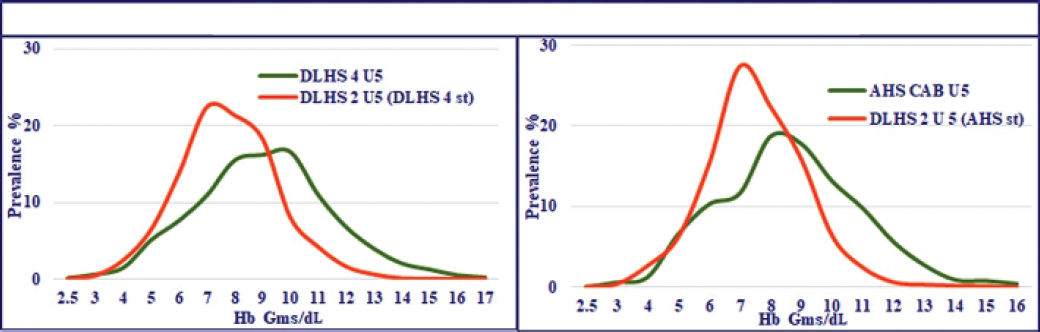
- Frequency distribution of Hb (DLHS 2, 4 and AHS CAB). DLHS, District Level Household Survey; AHS CAB, Annual Health Survey Clinical Anthropometric and Biochemical component; Hb, hemoglobin.
Discussion
NFHS 2, 3, and 4, NNMB micro-nutrient survey, DLHS 2, 4, and AHS CAB survey have all undertaken Hb estimation between 1999 and 2015. Data from the NFHS surveys suggest that there was a 5% increase in prevalence of anemia between NFHS 2 and 3 and a 10% reduction in prevalence of anemia between NFHS 3 and 4. The reason for the higher prevalence of anemia in NFHS 3 is not clear. This might at least in part be due to the problems in the method (Hemocue) used for Hb estimation.8-11 On the other hand as compared with DLHS 2, both DLHS 4 and AHS CAB (in their respective states) show substantial reduction in prevalence of anemia, increase in mean Hb, and shift to the right in frequency distribution of Hb. It is reassuring to note that despite continued poor coverage under IFA supplementation program there has been an improvement in Hb status of preschool children. Over the last four decades, there has been substantial improvement in per capita income and reduction in poverty and improvement in household food security; access to health care for malaria and hook worm infestation has improved and there has been a slow but steady decline in under-nutrition rates. It is possible that the observed reduction in anemia might be part of the overall improvement in nutrition and health status of preschool children.
There have been debates how far prophylactic IFA supplementation can reduce prevalence of anemia in countries with low iron intake and high prevalence of anemia. The WHO expert groups had consistently recommended oral iron supplementation as public health intervention for improving Hb and iron status and reducing the prevalence of anemia in preschool children. Systematic reviews of the randomized clinical trials with iron folic acid supplementation in preschool children have shown that even in situations where prevalence of anemia was high, iron folic acid supplementation for 3 months or longer resulted in improvement in mean Hb (~0.5–1 g/dL) and ferritin levels.12,13 Improvement was higher in daily supplementation as compared with biweekly or weekly supplementation, but compliance with daily supplementation was more difficult to maintain on long-term basis. Current WHO guidelines14 recommend daily IFA supplementation for 3 months every year in settings where prevalence of anemias is 40% or higher. For infants and young children (6–23 months) iron syrup containing 10 to 12 mg of elemental iron (strong recommendation, moderate quality of evidence) and for children aged 24 to 59 months, 30 mg of elemental iron as drops/syrup or tablets (strong recommendation, very low quality of evidence) are to be given. The WHO guidelines note that unlike IFA supplementation in school age children, the evidence base for the recommendations regarding preschool children is inadequate and emphasize the need for research studies documenting:
Optimal dose, schedule and duration of iron supplementation.
The effect of different doses and durations of iron supplementation on severity, prevalence of anemia.
Safety of long-term iron supplementation in children who are iron sufficient.
Countries with relatively lower prevalence of anemia have expressed concerns over potential adverse health consequences due to iron overload following IFA supplementation. WHO guidelines recommend that if the prevalence of anemia is 20 to 40%, intermittent regimens of iron supplementation can be considered. Malaria-endemic countries concern over safety of IFA supplements has been allayed based on the WHO data which have shown that iron supplementation did not increase the risk of clinical malaria or death in areas where regular malaria-surveillance and treatment services are provided.
Program managers in India accept that low and erratic availability of IFA syrup/drops and tablets is the major factor responsible for the current low coverage under IFA supplementation. Sorting out these supply chain related problems is an essential prerequisite for effective implementation of the IFA supplementation program and once this is achieved there will be reduction in prevalence of anemia. There is, however, a persistent worry about ability to ensure optimal coverage under program conditions for 3 to 6 year children year after year. Following IFA supplementation, not all anemic children become nonanemic; in children with low dietary intake of iron, there can be deterioration in Hb levels once supplementation is stopped.15 In the Indian context with low iron intake and 60 to 70% prevalence of anemia in preschool children, it is important to undertake operational research studies to document:
Optimal duration of supplementation—3 or 6 months/year.
The improvement in Hb and iron stores following IFA supplements.
The proportion of anemic children who become nonanemic after supplementation.
Sustainability of the supplementation program under service conditions.
Changes in Hb and iron stores 6 months after stopping of the supplementation.
All the Hb surveys indicate that though there has been some reduction in the prevalence of anemia, currently prevalence of anemia across all states of the country is unacceptably high. There is an urgent need to achieve a faster and sustained reduction in prevalence of anemia in preschool children. WHO14 guidelines as well as the NIPI16 guidelines recommend that as and when preschool children access health care, Hb estimation should be done and anemic children given appropriate treatment. One of the essential prerequisites for this strategy is accurate estimation of Hb. NIPI guidelines recommend Hb estimation using Hb color card or Sahli's Haemoglobinometer.16 Neither is accurate enough for correctly grading anemia and monitoring improvement with therapy. Hemocue has been advocated for use as it does not require accurate pipetting and results are immediately available; but it is expensive and not accurate.8-11 Experience with DLHS 2,4, and AHS CAB indicate that dried blood spot indirect cyanmethaemoglobin method is the most appropriate method for Hb estimation in community and primary health care settings. Auxiliary nursing midwives (ANMs) and laboratory technicians (LTs) can be trained for finger prick blood collection, depositing 20μL of blood on filter paper, drying it and putting in a plastic zip lock bag. All primary health centers have a LT; most of them have a colorimeter; so they can do Hb estimation by cyanmethaemoglobin method. Given the importance of anemia and need to operationalize ‘test and treat strategy’ to achieve more rapid decline in anemia, it is essential to invest time in training ANMs in finger prick blood collection and technicians in Hb estimation by cyanmethaemoglobin method. Once the accurate estimation of Hb is available at all levels of care, it might be possible to effectively implement the ‘test and treat strategy’ and achieve more rapid reduction in prevalence of anemia.
Experience from long-term supplementation programs across countries have shown, it is difficult to sustain supplementation programs year after year; personnel required for distributing, counseling, and monitoring supplementation programs make them expensive. In this context, WHO14 advocates use of food fortification with iron. NIPI16 guidelines envisage improving the Hb status and reducing the prevalence of anemia using a multi-pronged strategy. The strategy envisages:
Improvement in dietary intake of vegetables and inexpensive fruits rich in iron and folic acid;
increase in use of iron fortified iodized salt (DFS) to begin with through the hot cooked meal in the Integrated Child Development Service (ICDS) anganwadi centers and progressively leading to improved access to and use of DFS at household level;
improved coverage under biweekly iron folic acid supplementation to under-five children through Village Health and Nutrition Days and home visits by ASHA; and,
‘test and treat strategy’ for early detection and treatment of anemia.
Effective implementation of the comprehensive package of interventions recommended in the NIPI guidelines is urgently needed to achieve rapid and sustained reduction in anemia.
Conclusion
Data from national surveys using accurate time tested methods for Hb estimation have shown that, in India there has been some improvement in Hb levels in preschool children in the last decade, but prevalence of anemia continues to be unacceptably high.
Data from the Indian surveys have shown the importance of using accurate method of Hb estimation to monitor improvement in Hb over time. It is essential to use accurate method of Hb estimation in large scale national surveys across the world, as the world embarks on monitoring improvement in Hb over time to assess progress toward sustainable development goals (SDG) target for anemia.
Acknowledgments
The authors acknowledge with gratitude IIPS for providing raw data of DLHS 2 and 4, Ministry of Health and Family Welfare, Government of India for providing the raw data of AHS CAB. The raw data of NFHS 2, 3, and 4 were obtained from Demographic and Health Survey Program ICF International. The data analysis was supported through a grant provided by the Tata Trust.
Conflict of Interest
None declared.
Funding
This study was funded by Tata Trust.
References
- National Family Health Survey (NFHS) 2. Available at: http://rchiips.org/nfhs/nfhs2.shtml (accessed )
- [Google Scholar]
- National Family Health Survey (NFHS) 3. Available at: http://rchiips.org/nfhs/nfhs3.shtml (accessed )
- [Google Scholar]
- National Family Health Survey (NFHS) 4 Fact sheets. Available at: http://rchiips.org/nfhs/factsheet_NFHS-4.shtml (accessed )
- [Google Scholar]
- PREVALENCE OF MICRONUTRIENT DEFICIENCIES NNMB technical report. . 2003;22 Available at: http://nnmbindia.org/NNMB%20MND%20REPORT%202004-Web.pdf. (accessed )
- [Google Scholar]
- DLHS-2 - District Level Household & Facility Survey. Available at: http://rchiips.org/PRCH-2.html (accessed )
- [Google Scholar]
- DLHS-4 - District Level Household & Facility Survey. Available at: http://rchiips.org/DLHS-4.html (accessed )
- [Google Scholar]
- Annual Health Survey: CAB component. Available at: http://www.censusindia.gov.in/2011census/hh-series/cab.html (accessed )
- [Google Scholar]
- A comparative study on prevalence of anaemia in women by cyanmethemoglobin and hemocue methods. Indian J Community Med. 2002;27(02):58-61.
- [Google Scholar]
- Comparison of HemoCue method with cyanmethemoglobin method for estimation of hemoglobin. Indian Pediatr. 2002;39(08):743-746.
- [Google Scholar]
- Validation of hemoglobin estimation using Hemocue. Indian J Pediatr. 2003;70(01):25-28.
- [CrossRef] [PubMed] [Google Scholar]
- Comparison of hemoglobin estimates from filter paper cyanmethemoglobin and HemoCue methods. Indian J Community Med. 2004;29(03):149.
- [Google Scholar]
- Effects of daily iron supplementation in 2- to 5-year-old children: systematic review and meta-analysis. Pediatrics. 2013;131(04):739-753.
- [CrossRef] [PubMed] [Google Scholar]
- Effect of daily iron supplementation on health in children aged 4–23 months: a systematic review and meta-analysis of randomised controlled trials. Lancet Glob Health. 2013;1:e77-e86.
- [CrossRef] [PubMed] [Google Scholar]
- Guideline: Daily Iron Supplementation to Infants and Children Guideline. Geneva: World Health Organisation; 2016.
- [Google Scholar]
- Effect of supplementation with ferrous sulfate or iron bis-glycinate chelate on ferritin concentration in Mexican schoolchildren: a randomized controlled trial. Nutr J. 2014;13(01):71.
- [CrossRef] [PubMed] [Google Scholar]
- Guidelines for Control of Iron Deficiency Anaemia. Available at: http://www.pbnrhm.org/docs/iron_plus_guidelines.pdf (accessed )
- [Google Scholar]